


Table of contents
- How to create and add widgets to your dashboard
- Step 1: go to your dashboard
- Step 2: add a new dashboard (optional)
- Chart type selector in the widget settings
- Step 3: open the widget menu
- Step 4: choose the chart type and the widget category
- Step 5: customise your widget
- Step 6: apply the filters
- Step 7: save
- Step 8: add more widgets
- Step 9: organise your widgets
- Step 10: save the changes
- Additional tips
How to create and add widgets to your dashboard
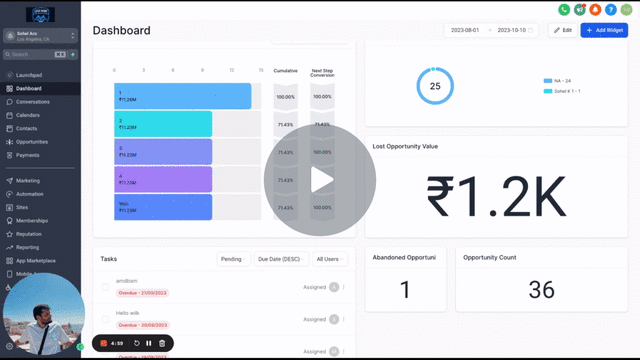
Adding widgets to your dashboard lets you access important data and metrics easily, all in one place. Whether you are monitoring contacts, appointments or sales performance, customising the dashboard makes sure you always have the information that is most useful to your business right at hand.
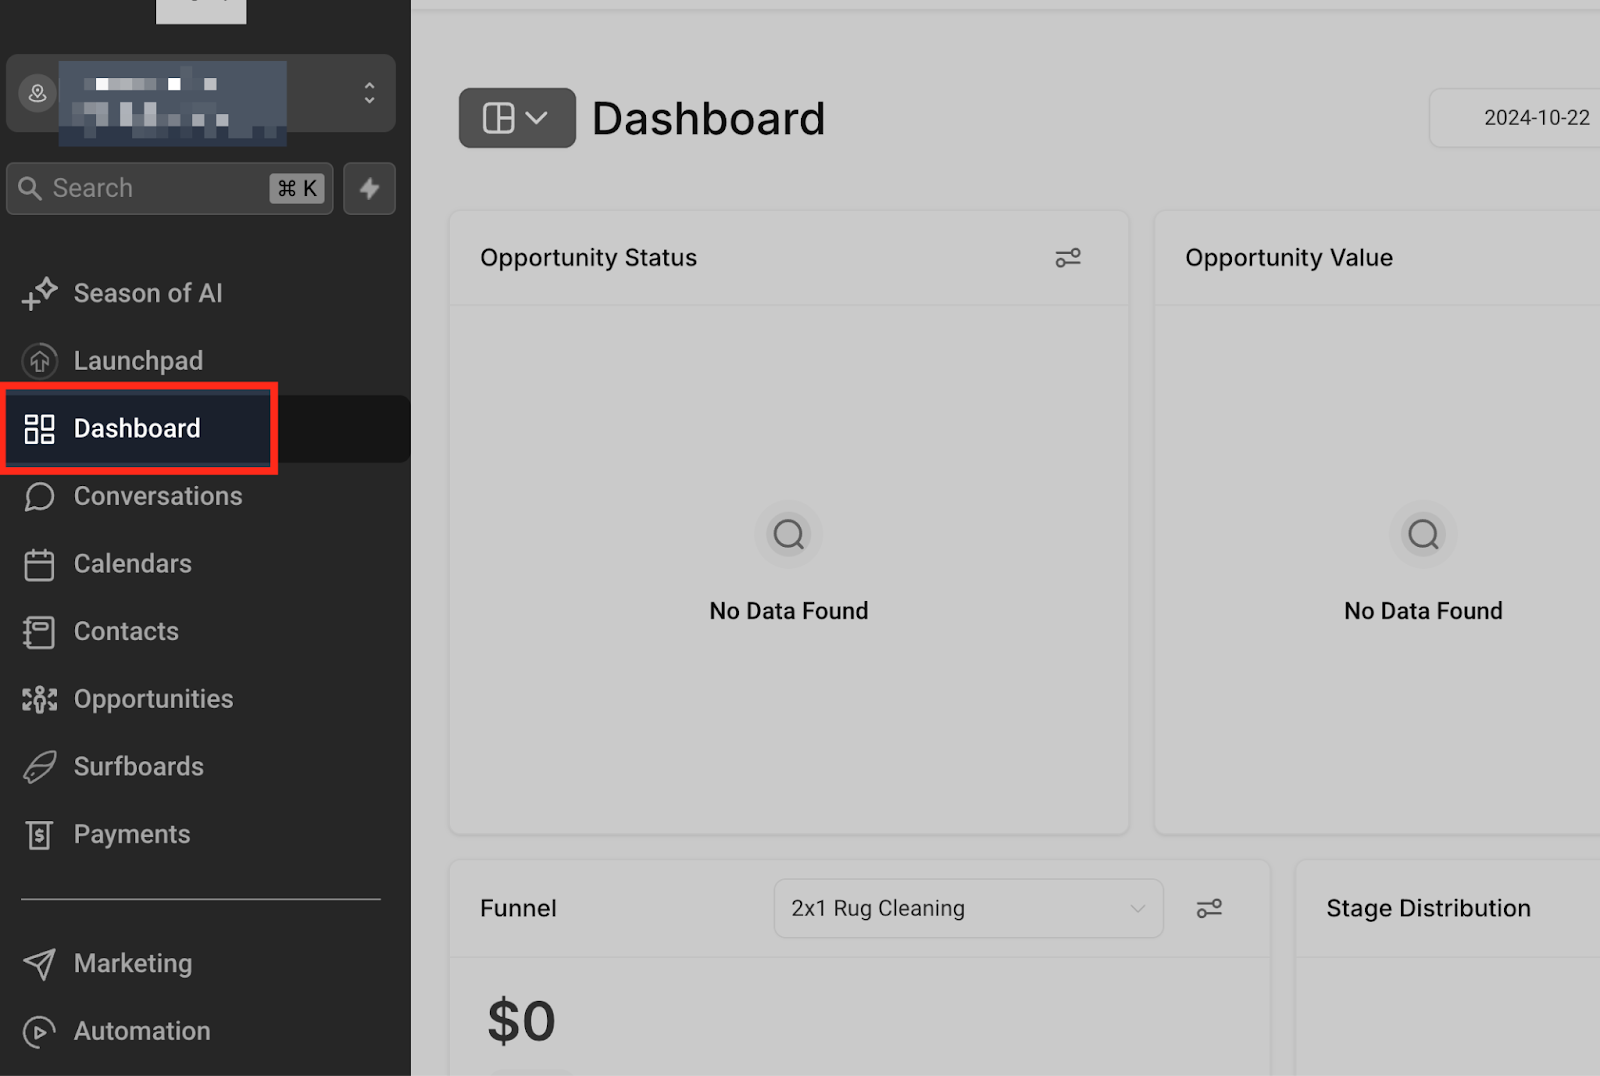
Step 1: go to your dashboard
Sign in to your account and select the Dashboard tab in the menu. You will be taken to the default dashboard of your account.
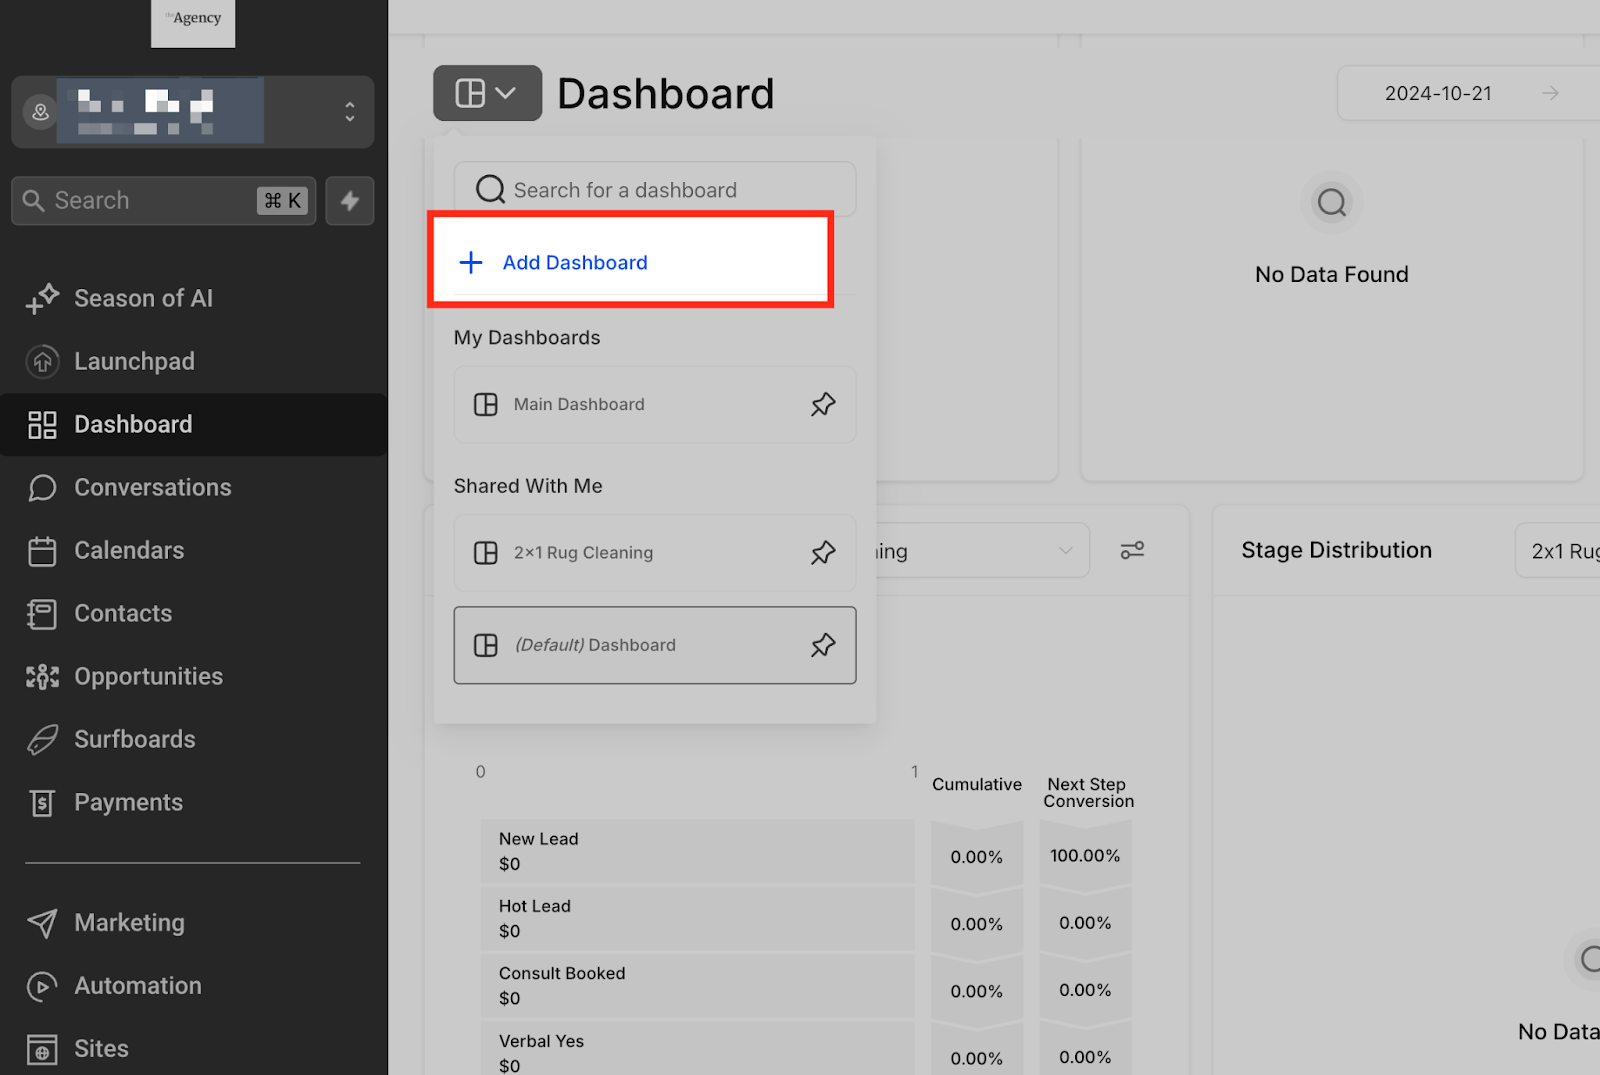
Step 2: add a new dashboard (optional)
If you prefer to create a new dashboard instead of editing the default one, click the blue Add Dashboard button.
Select the "Select a blank dashboard" option.
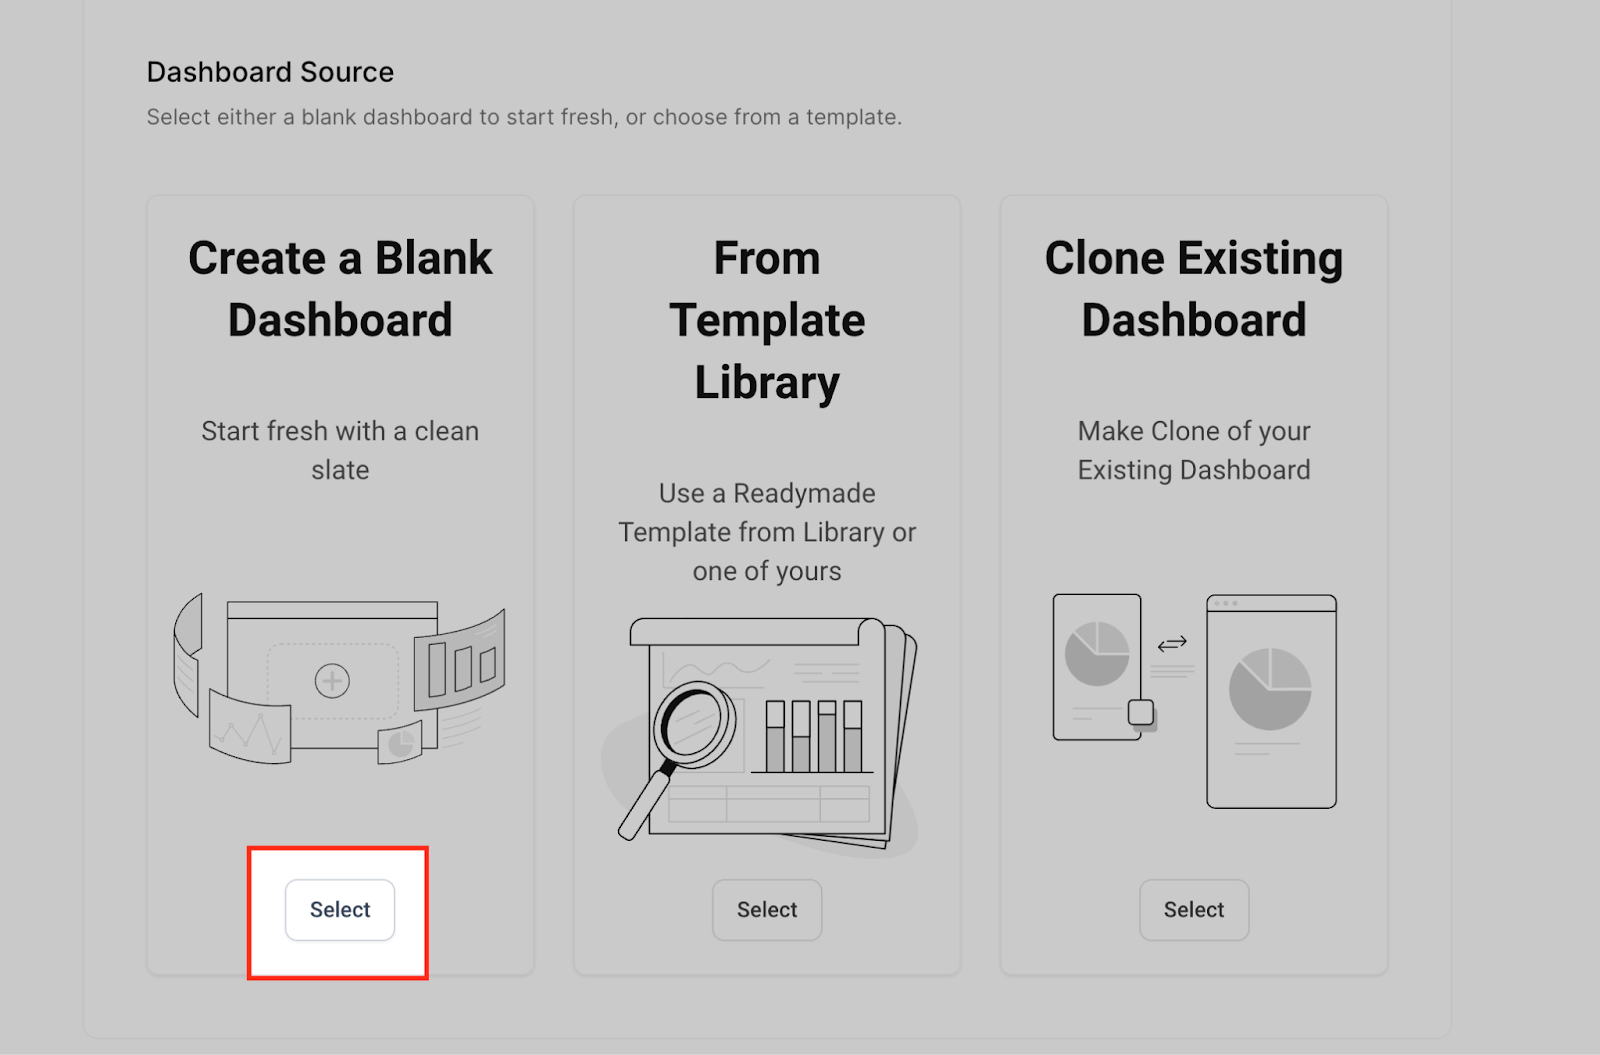
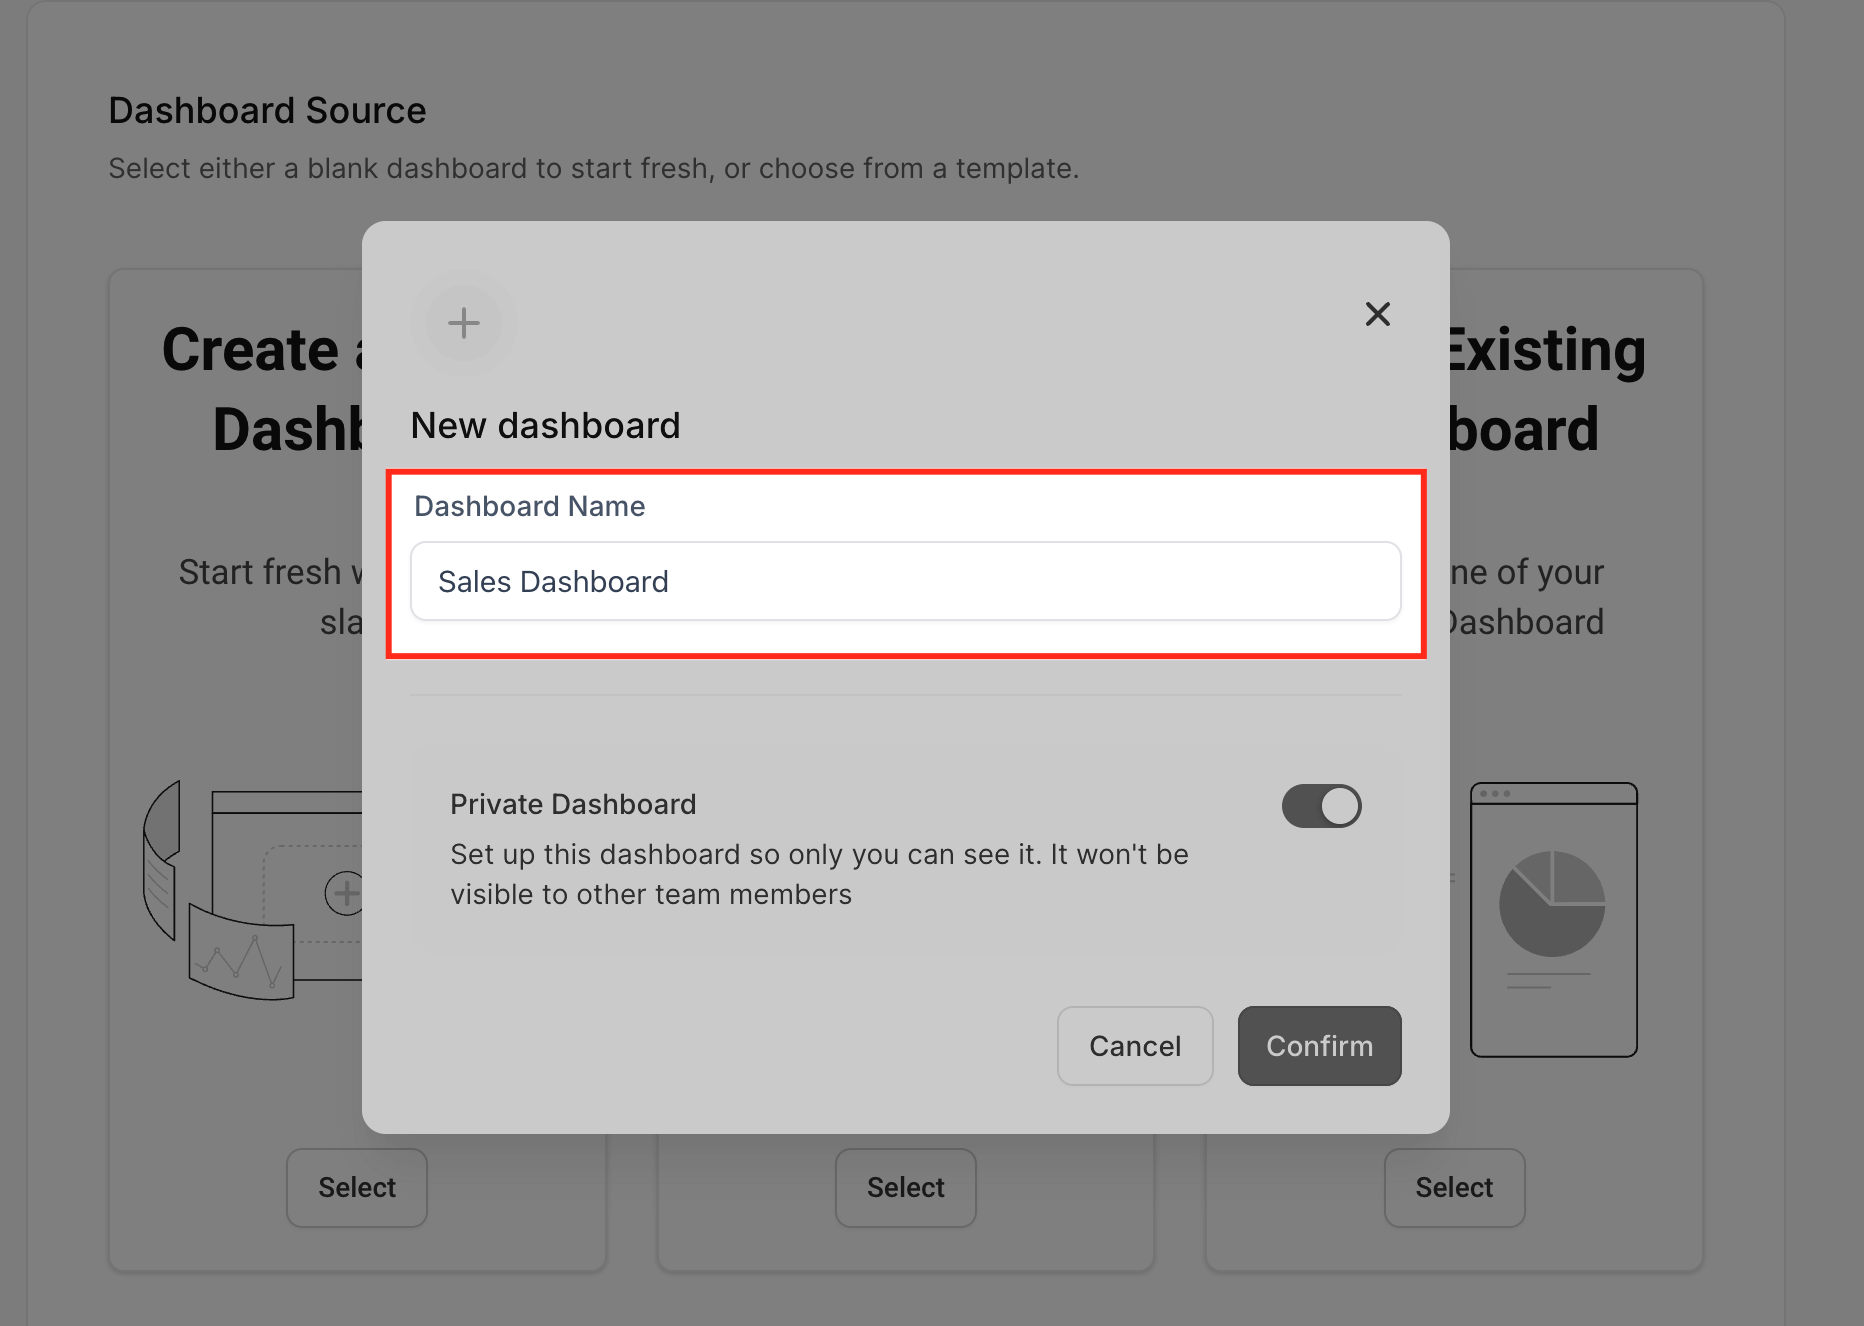
Give your dashboard a name (for example, "Sales dashboard").
Next, choose whether the dashboard should be Private (visible only to you) or For everyone (visible to all the users of the account).
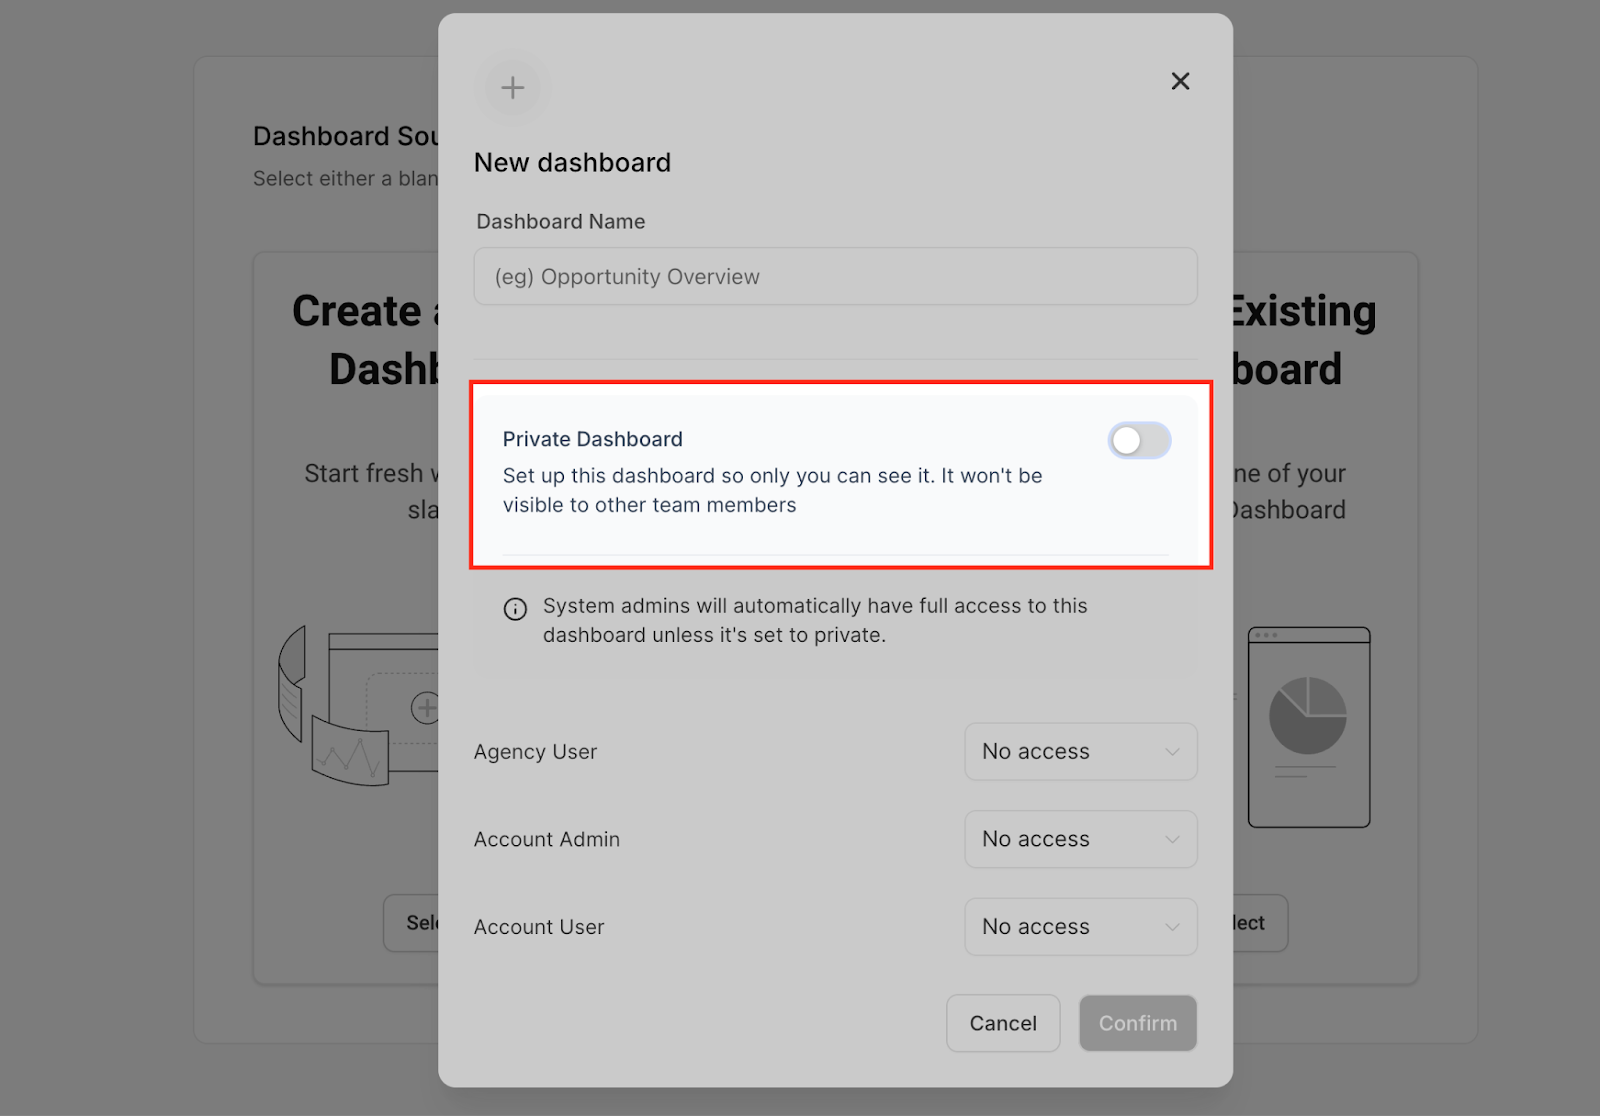
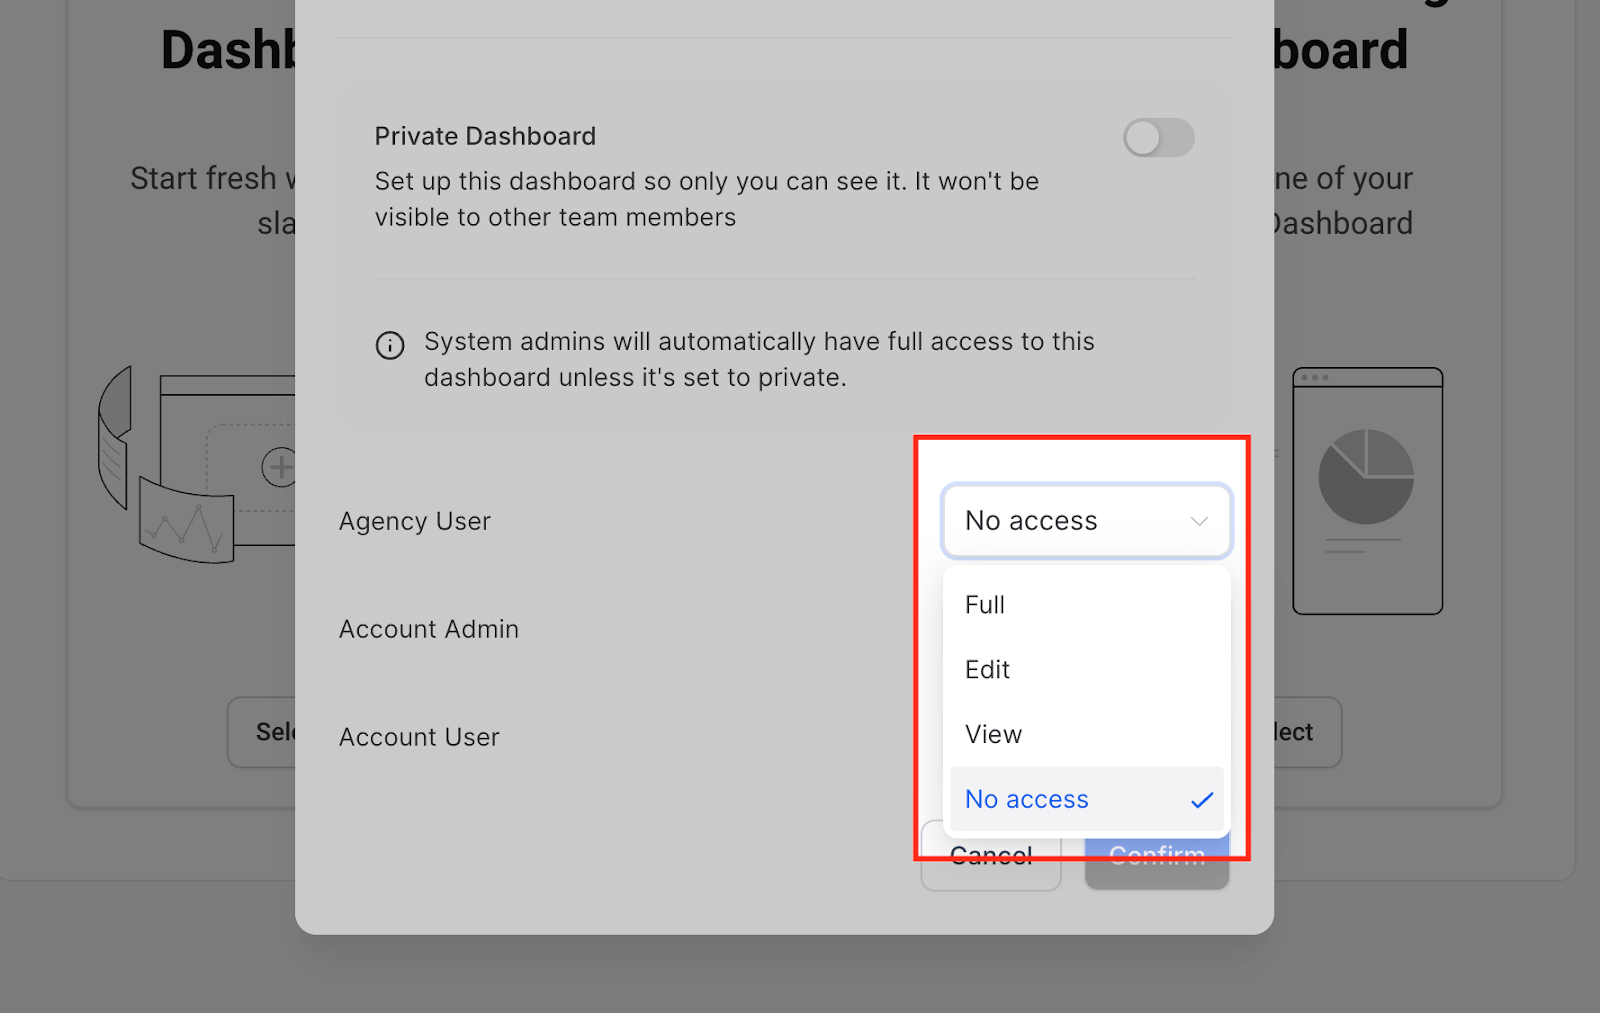
Once you have selected your preference, click Confirm. You will now have a blank dashboard ready to be customised.
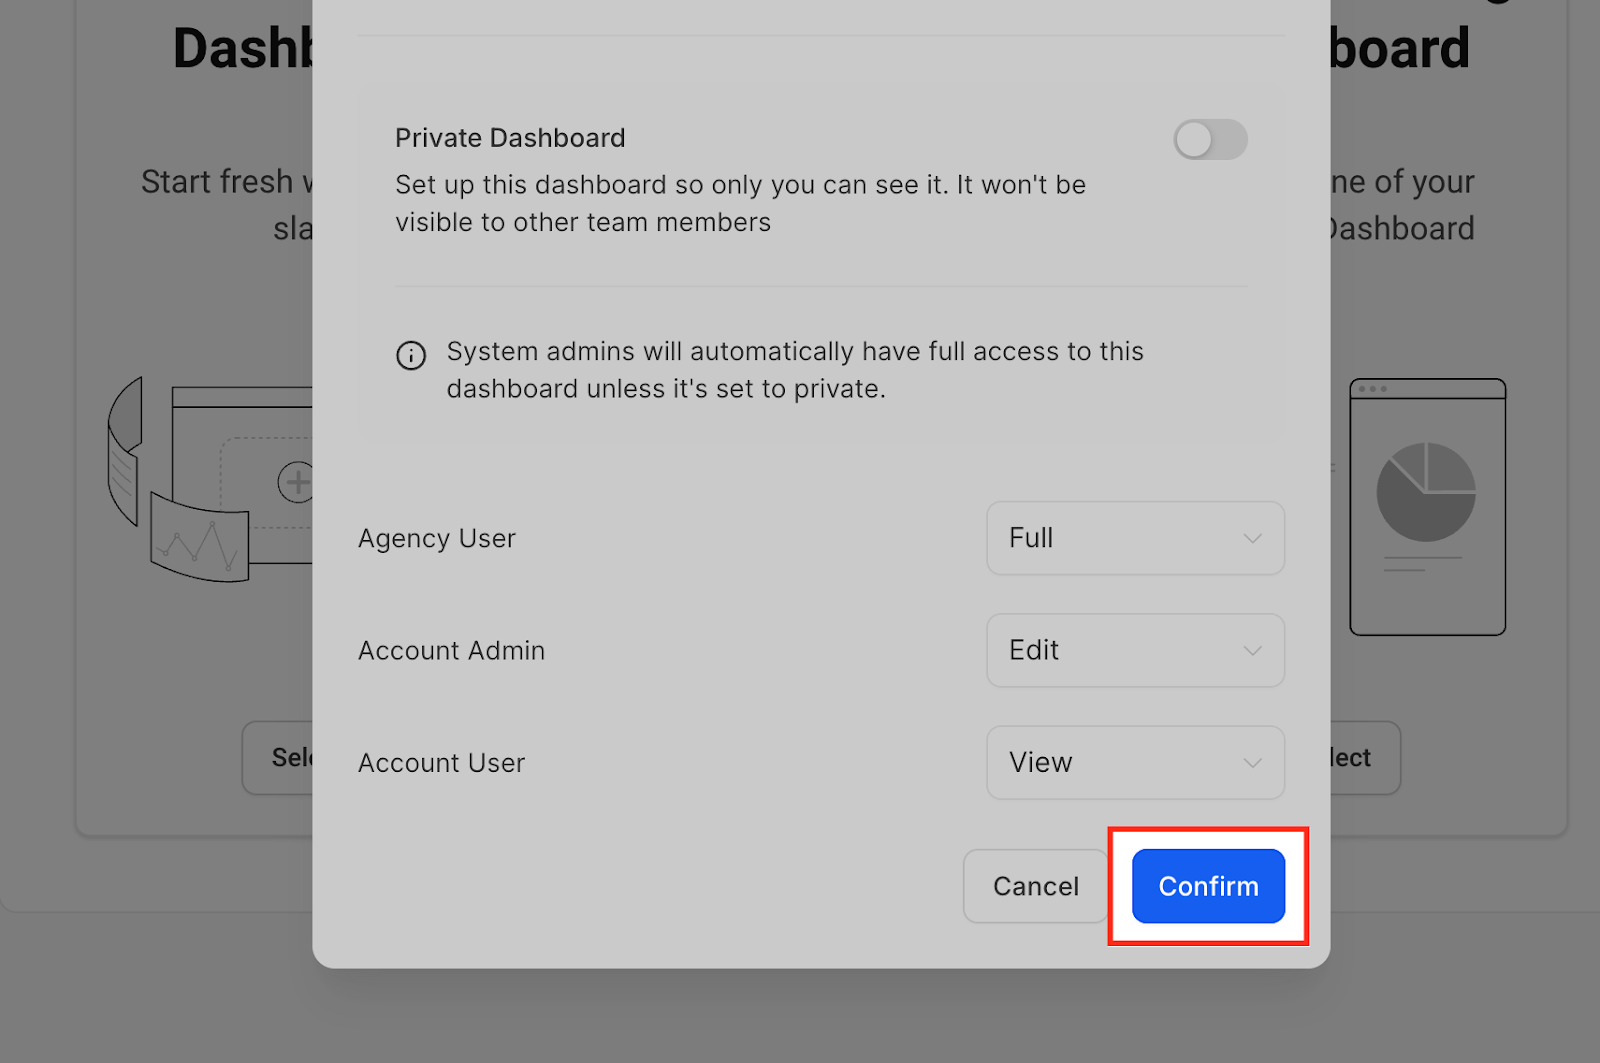
Chart type selector in the widget settings
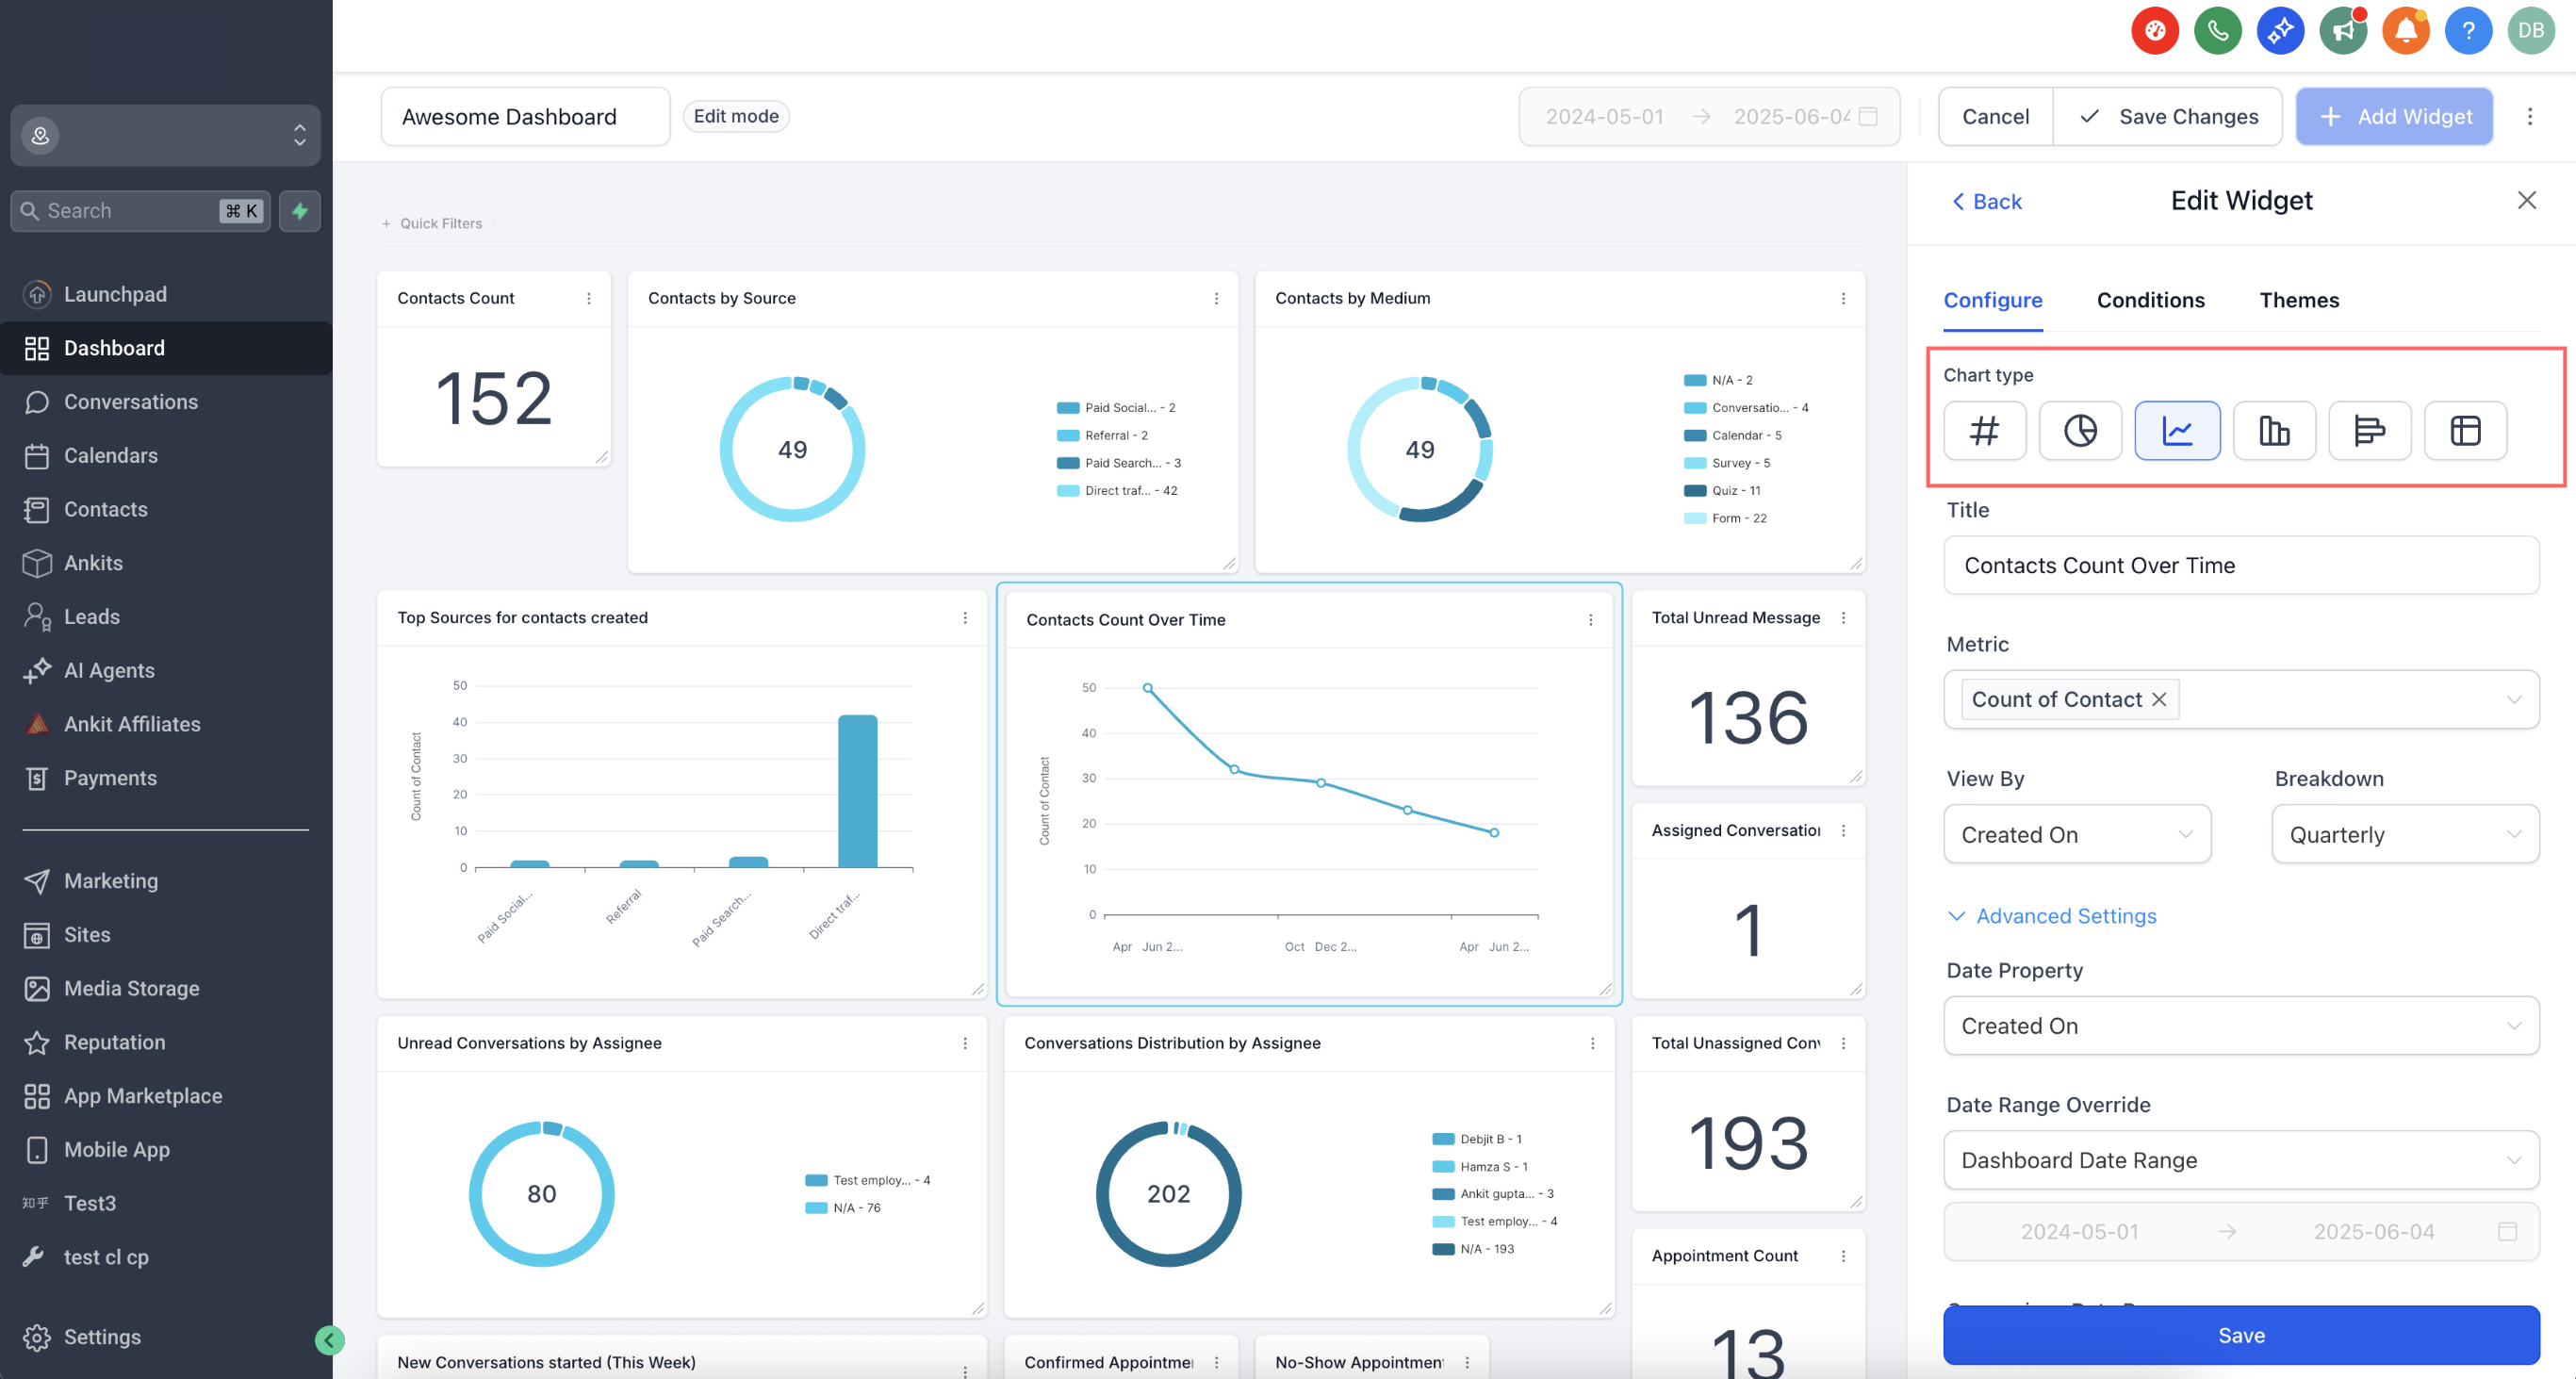
Choosing the right visualisation makes trends easier to spot and speeds up your analysis. You can select the chart type directly in the Configure section without leaving the editing process.
Procedure
- Open the widget editor and go to Configure.
- Use the Chart type field to choose a visualisation (bar, line, pie, and so on).
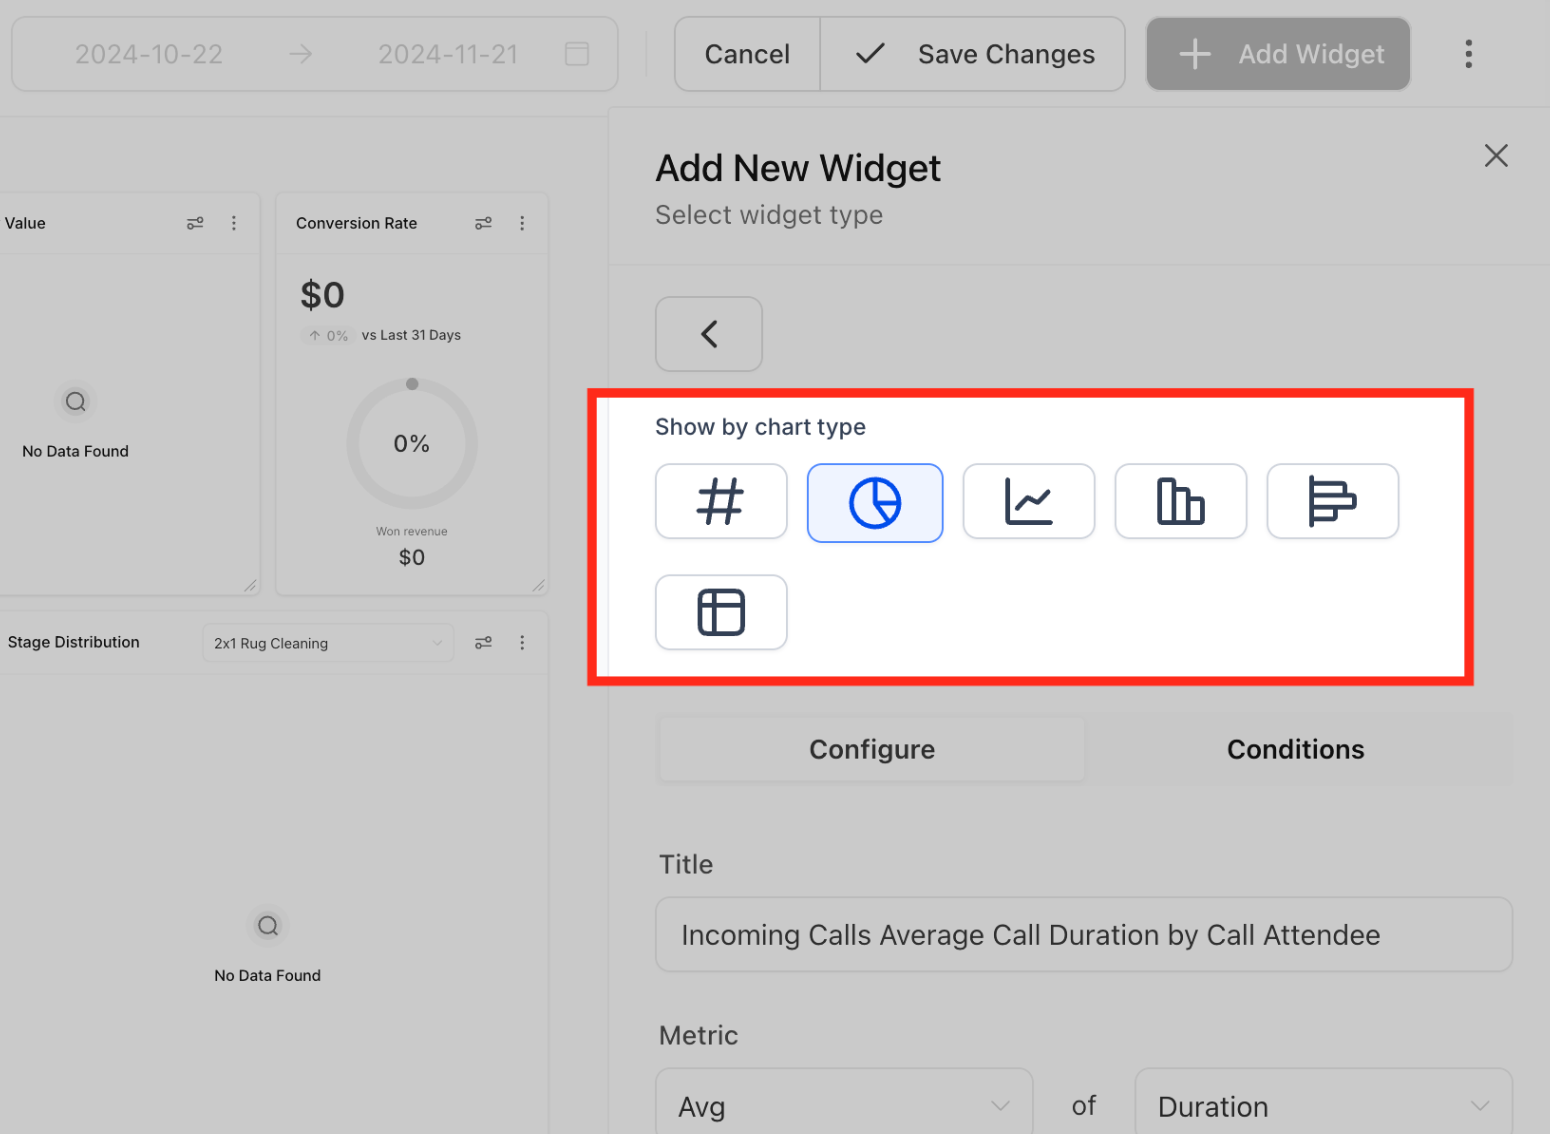
- Check the live preview and make any changes you need, then move on to Conditions or Save.
Step 3: open the widget menu
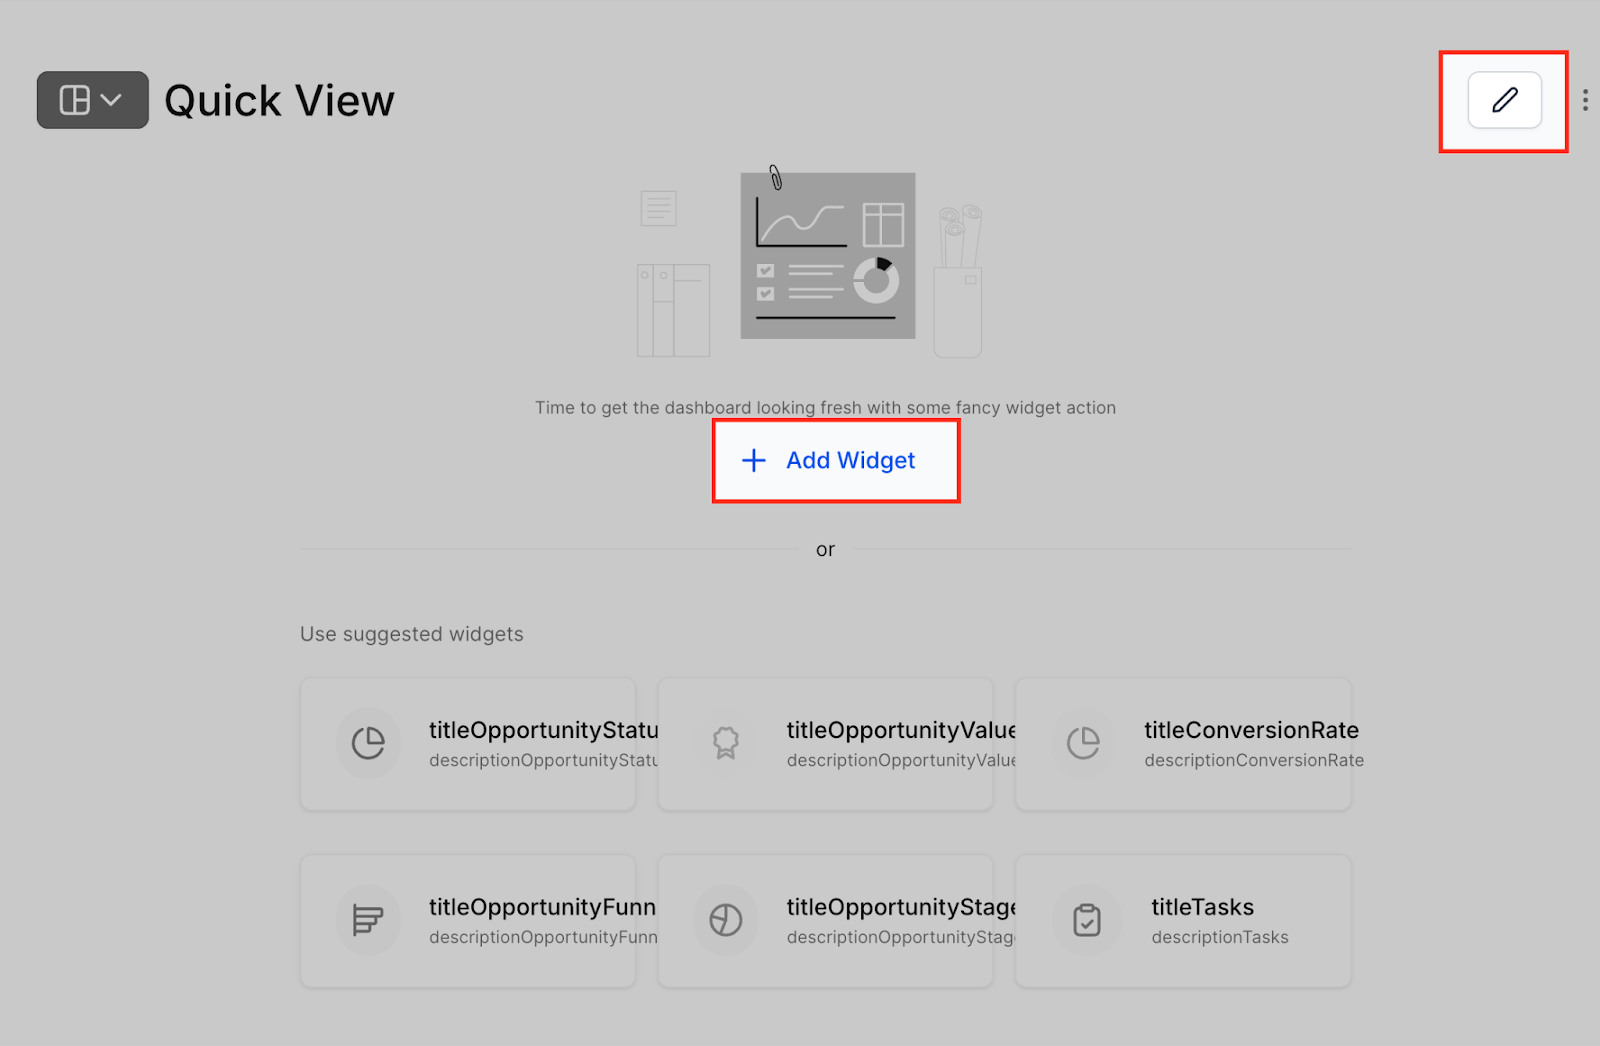
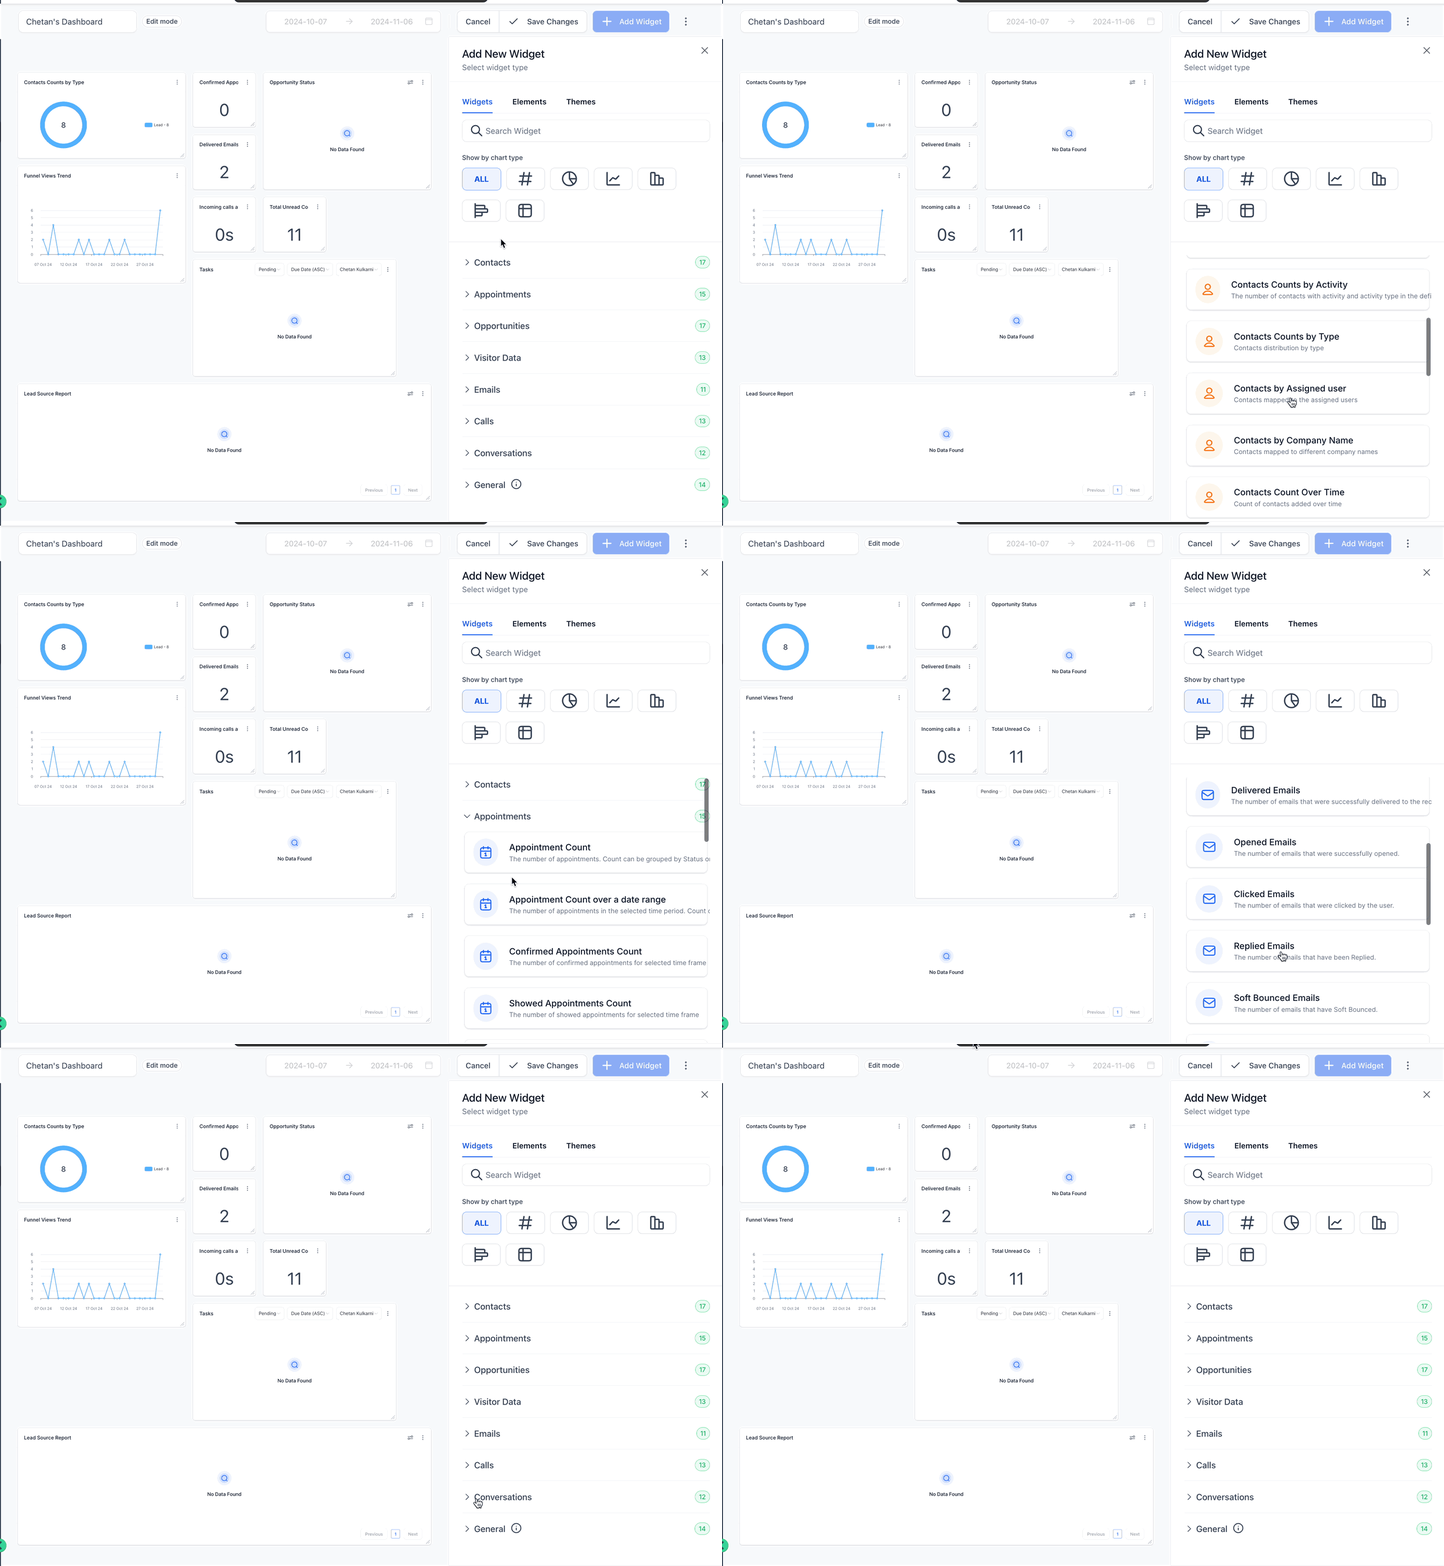
To add a widget, click the Add Widget button. If you want to add widgets to an existing dashboard, you can click the pencil icon in the top right-hand corner. This will open the widget menu on the right-hand side of the screen.
Step 4: choose the chart type and the widget category
Select the type of widget you want to add by browsing the categories or using the search bar to find a specific widget.
1. Select the chart type for the data visualisation. You can choose between different types such as Numeric, Pie chart, Line chart, Bar chart, Horizontal bar chart and Table.
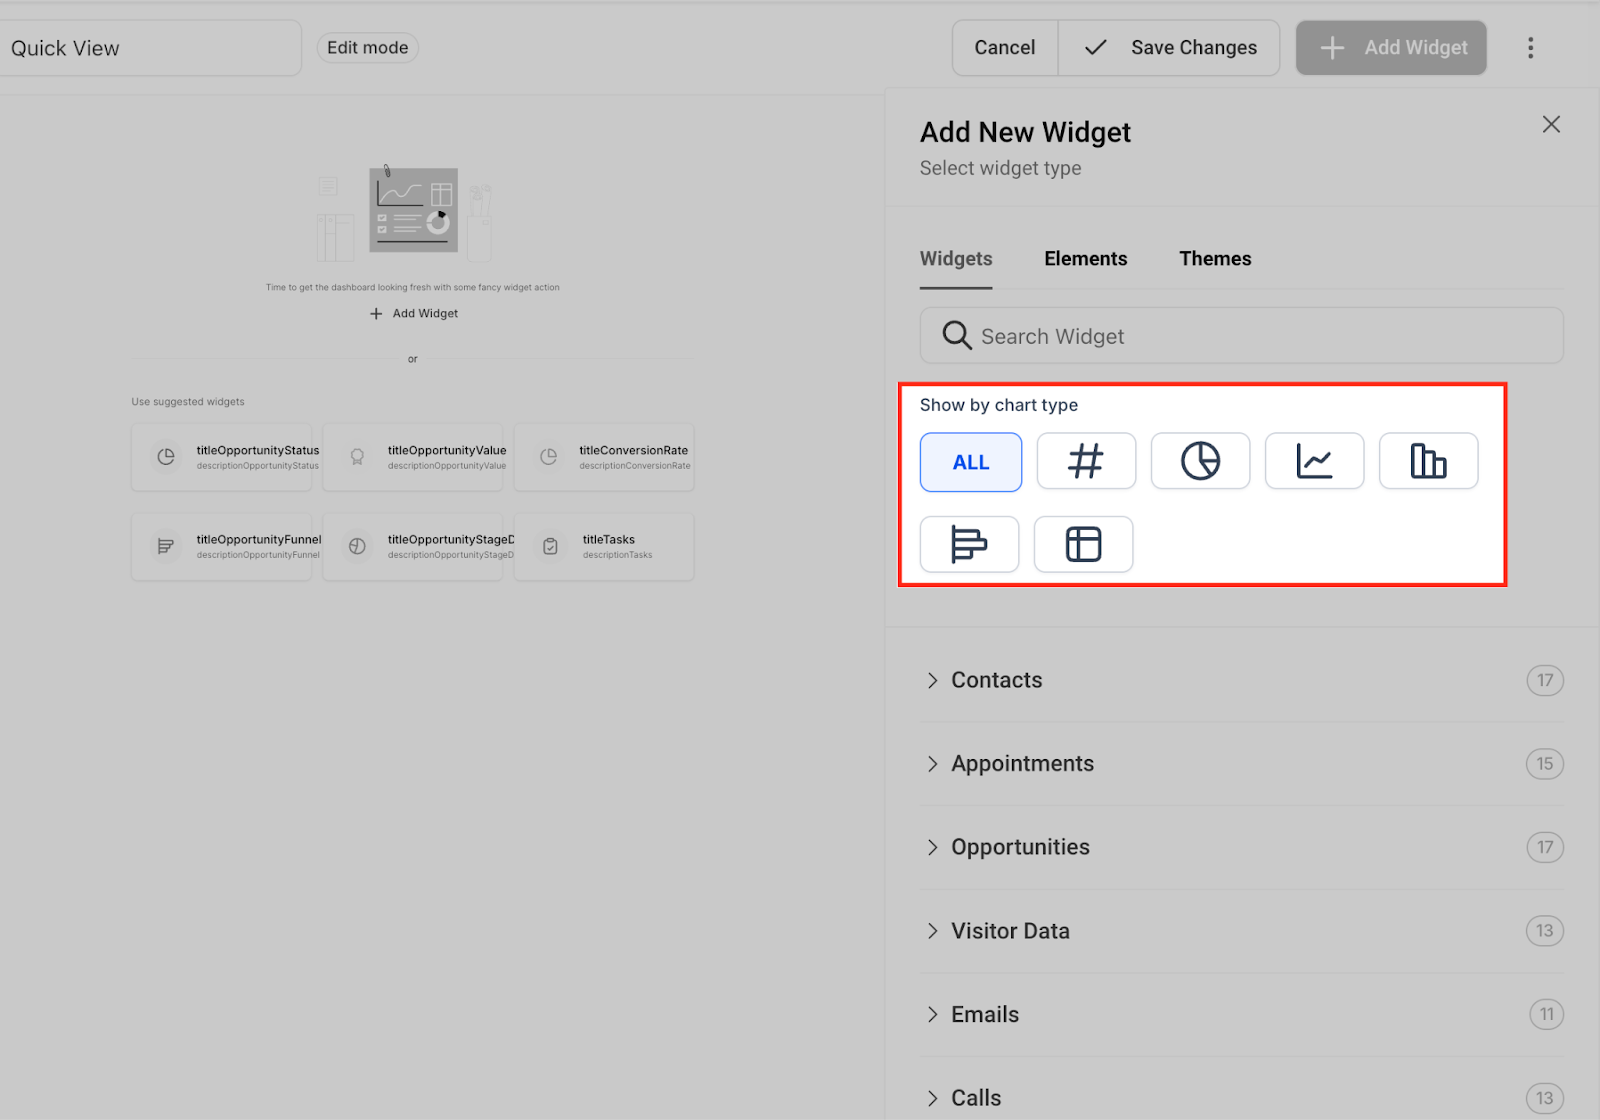
2. Select the widget category based on the data you want to show on the dashboard. The different widget categories you can choose from are listed below.
Step 5: customise your widget
In the Widget Settings panel:
- Chart type selection: Choose how you want your data to be displayed. The chart type selector is now built into the widget settings for quicker access.
- Title and description: Optionally add a name and a short description for the widget.
Step 6: apply the filters
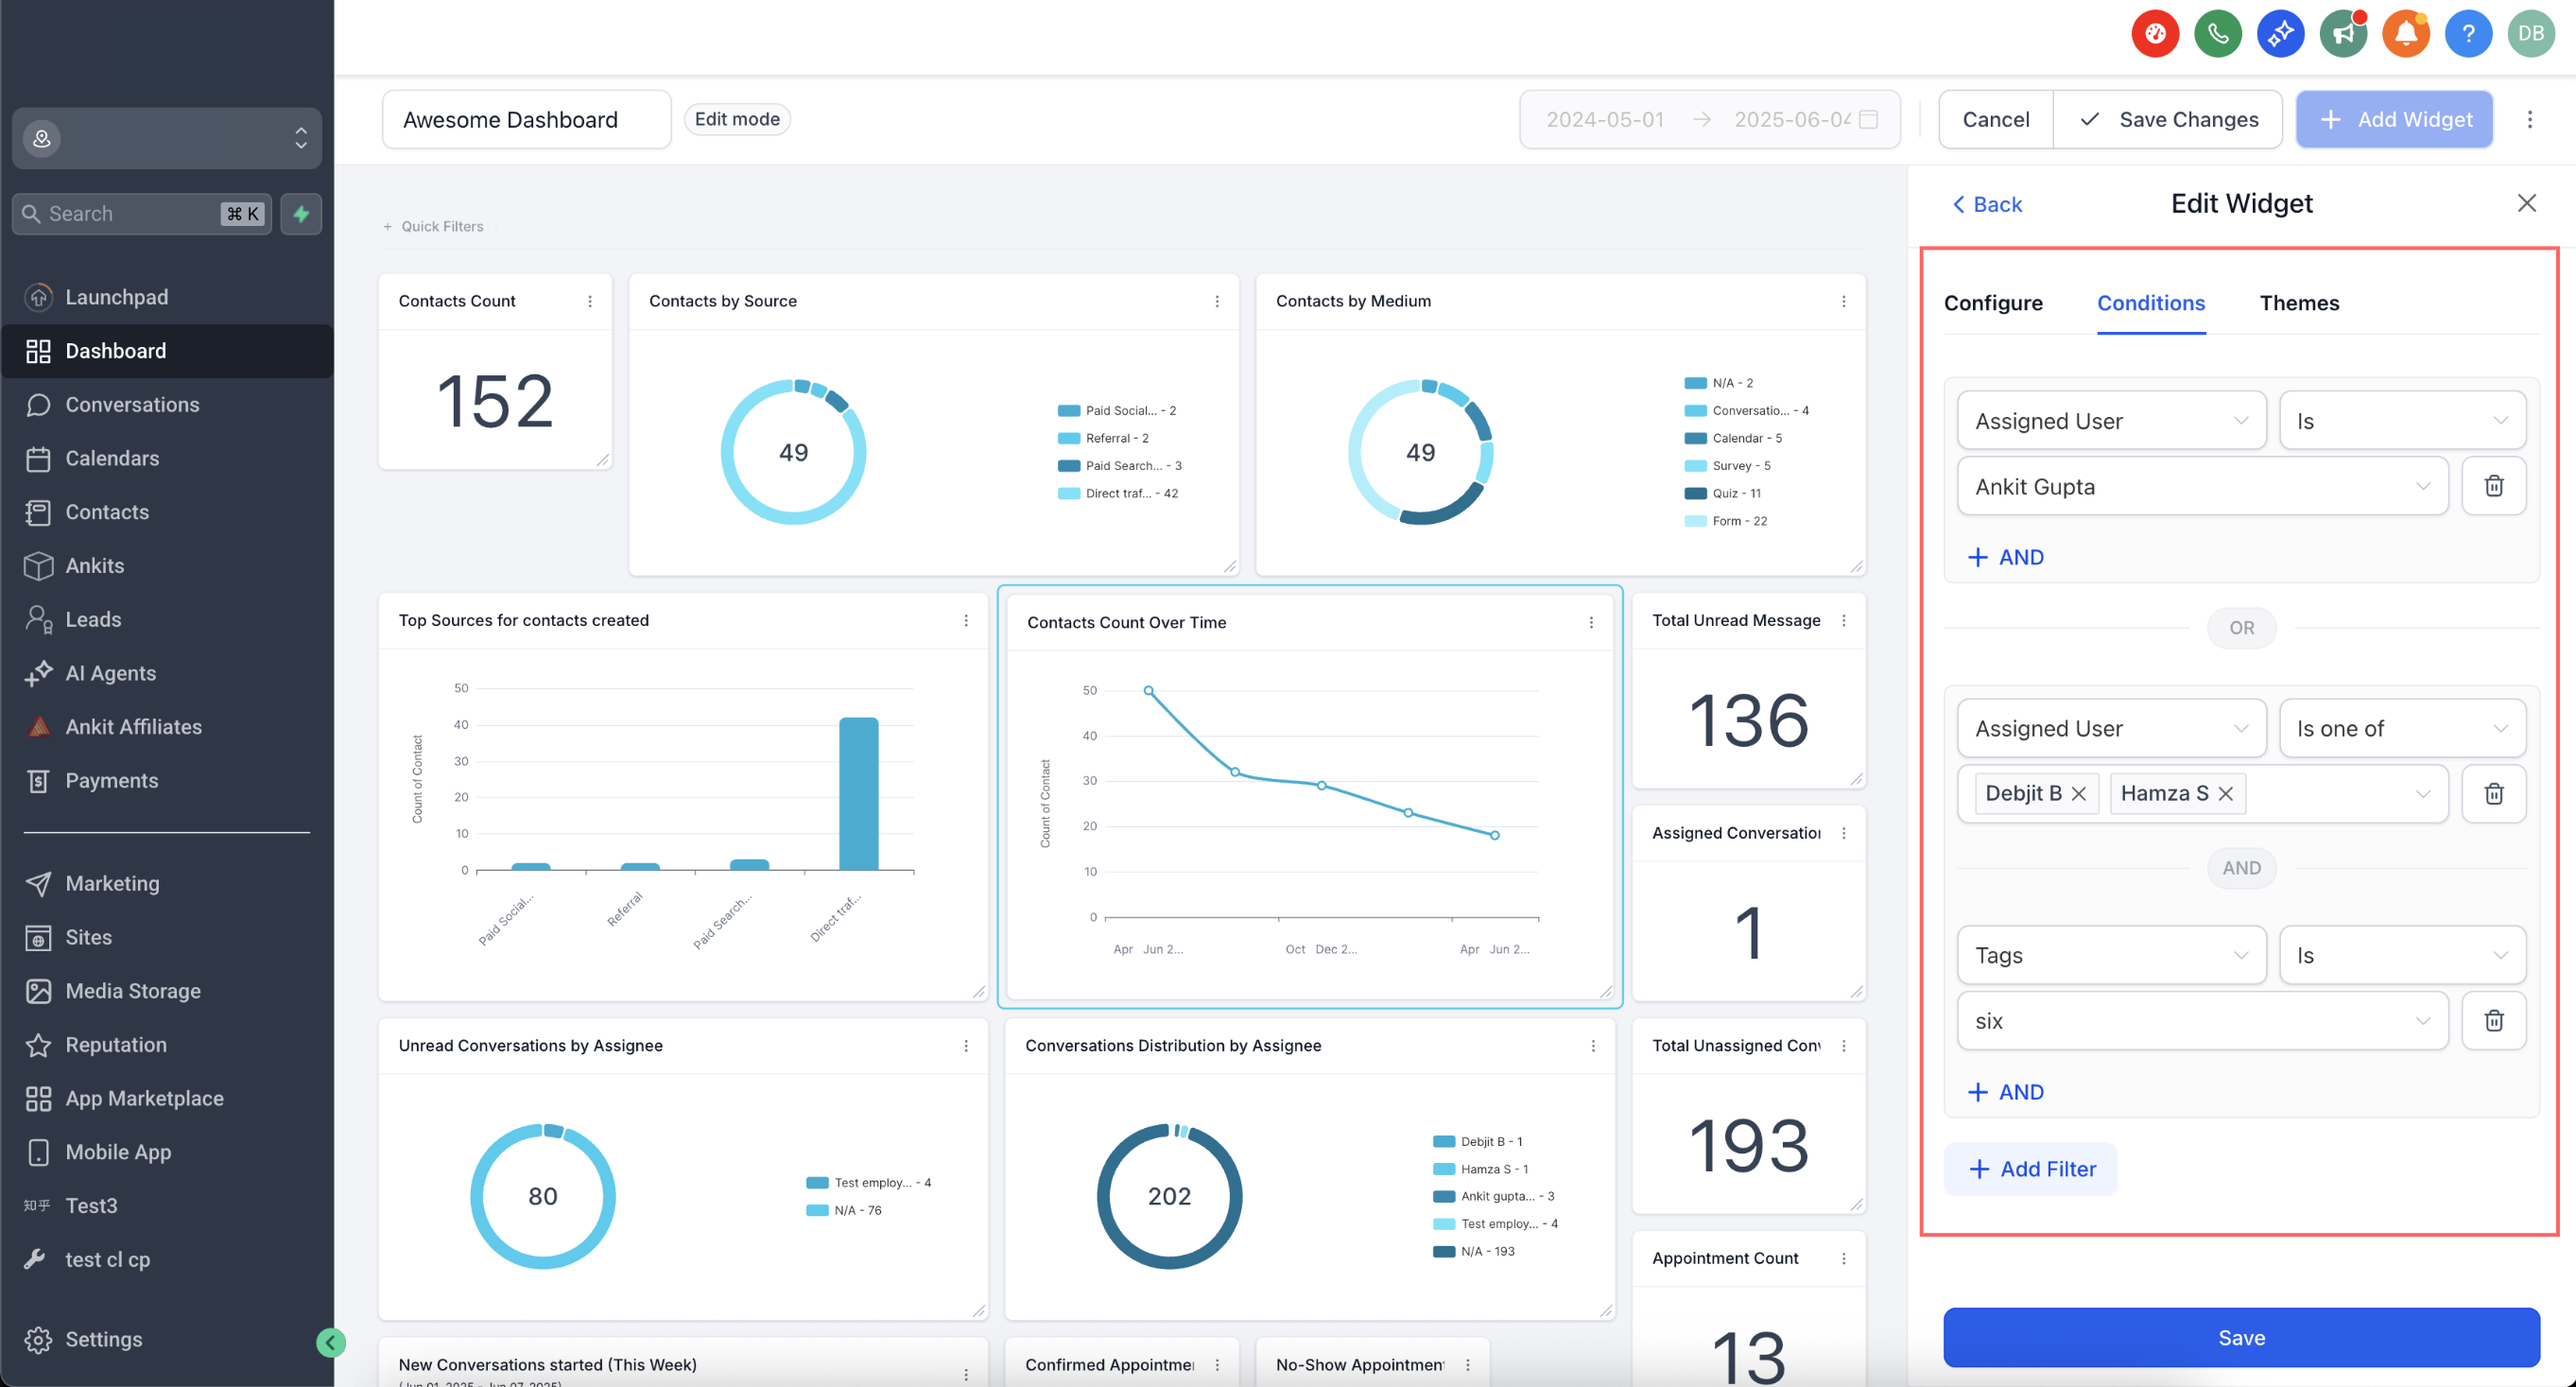
Go to the Conditions tab to apply filters to your widget data:
- Click "Add filter" to create your first filter group.
- Use "+AND" to keep adding more filters within the same group.
- Click "+Add filter" again to start a new group. This will create an OR condition between the groups.
- You can now reuse the same filter (for example, "Session source") in different groups.
Important note (Attribution fields)

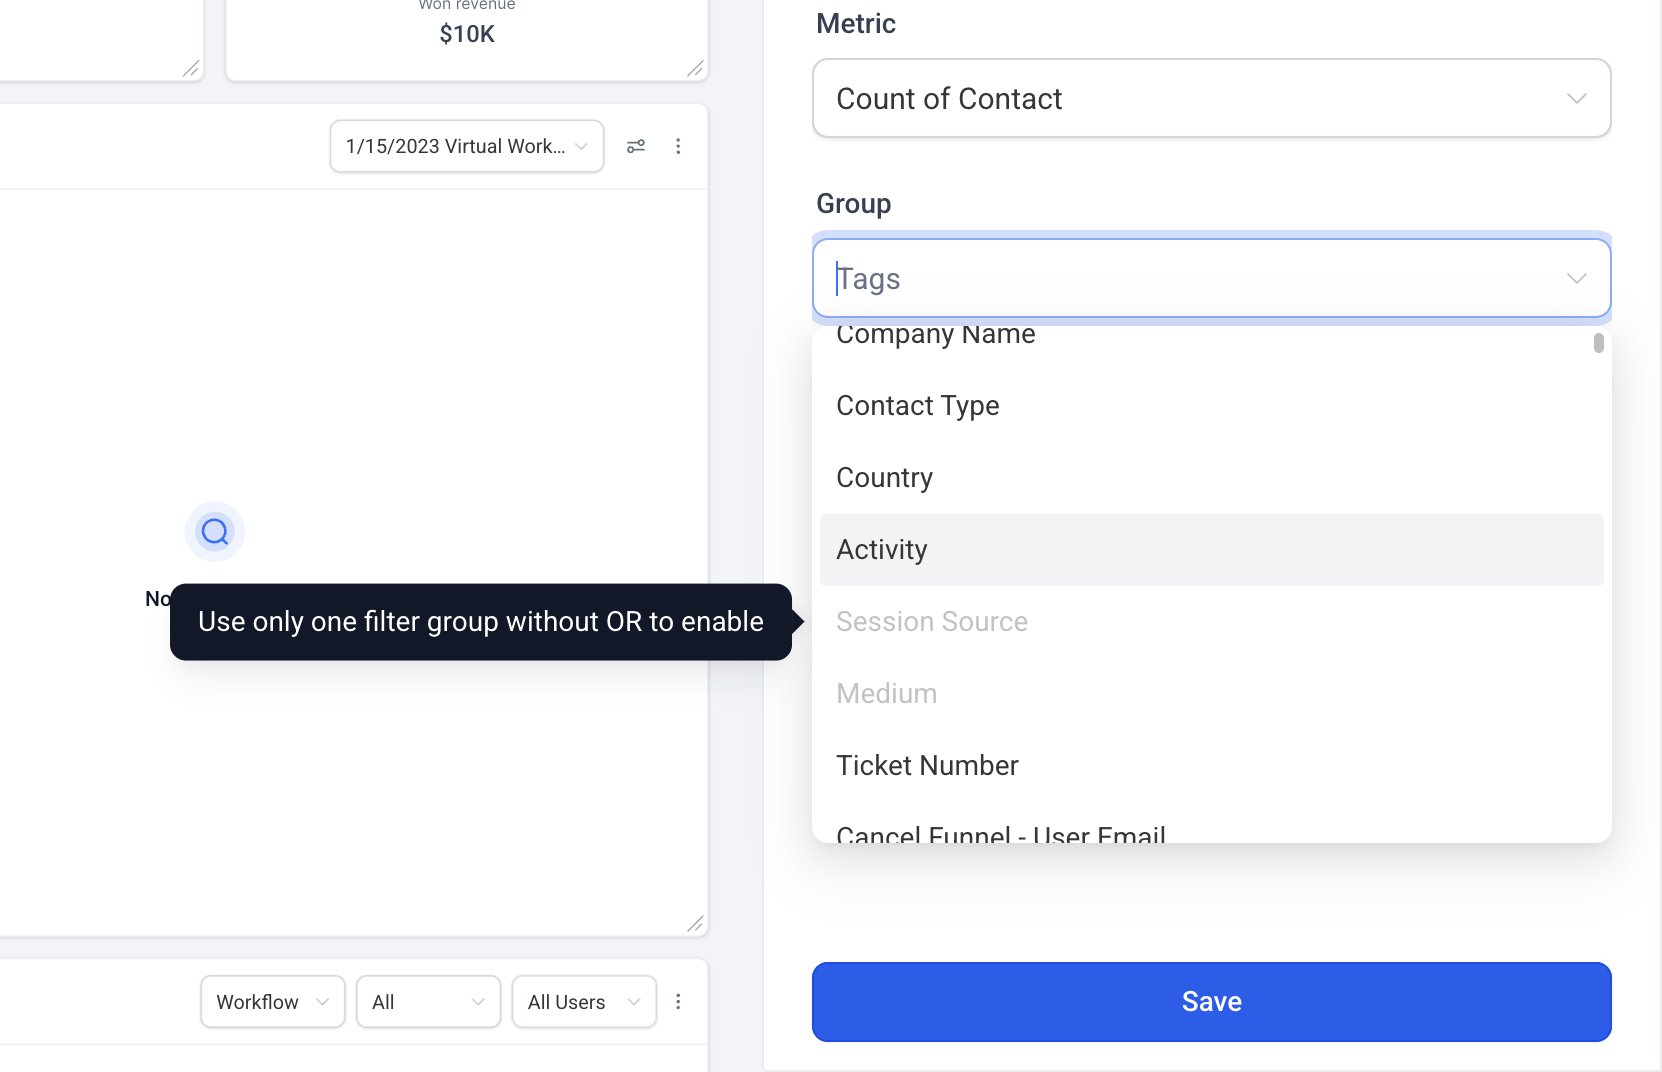
If you are using attribution fields such as Session source or Session medium in the Group by or View by drop-down menus (for example, for pie or line charts):

* Only one composite filter group is allowed.
* That single filter group must include the Attribution type (First touch or Last touch) as a filter.
* If several filter groups are added, the attribution-based fields (Session source/medium) will be disabled in the drop-down menu.

This limitation guarantees data consistency when you work with attribution metrics.
Step 7: save
Once everything is set up, click Save to add the widget to your dashboard.
Step 8: add more widgets
To get a complete view of your data, repeat the process to add more widgets.
Step 9: organise your widgets
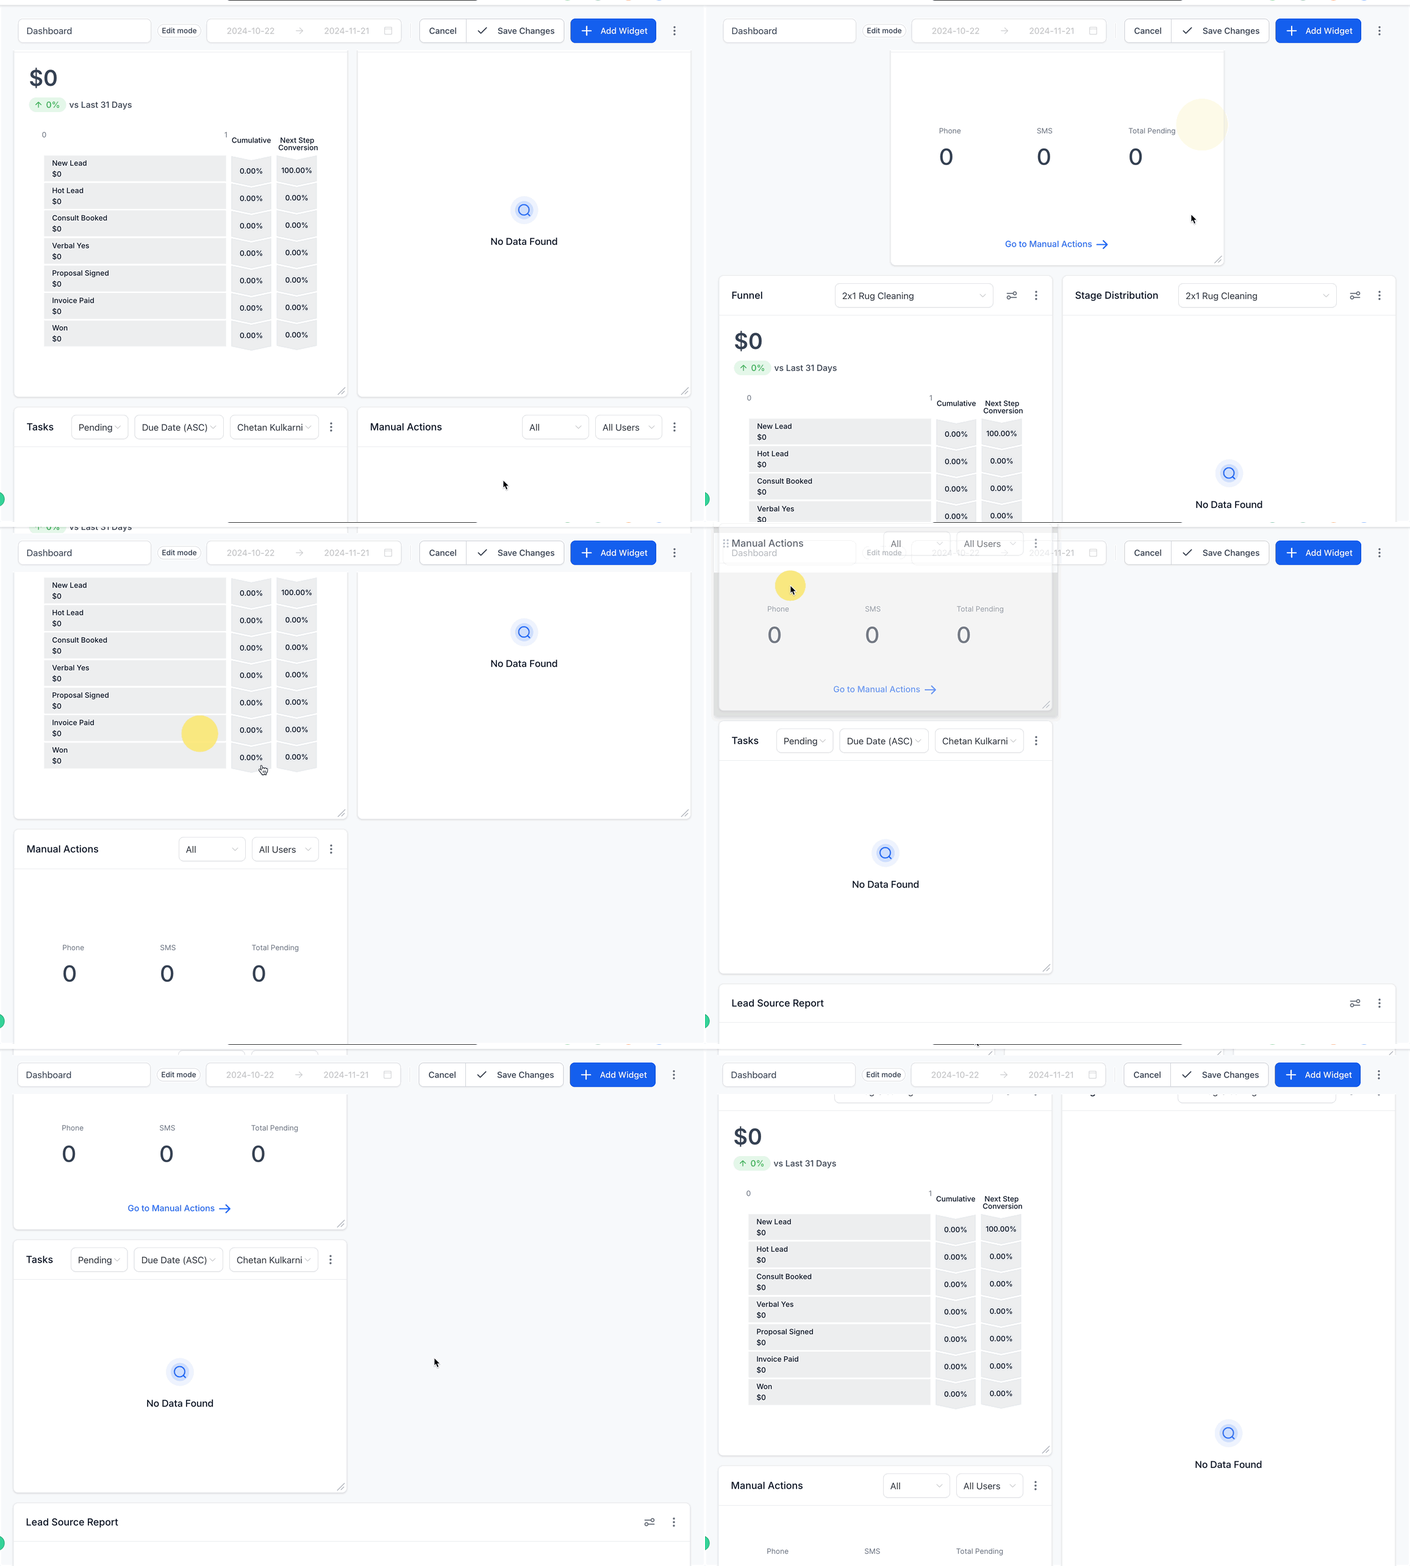
Once you have added the widgets, you can resize and reposition them as you need. Drag and drop the widgets and adjust their size for better visibility.
Step 10: save the changes
Once you have organised your widgets, click Save changes at the top of the dashboard. This makes sure your new configuration is saved and ready to use.
Additional tips
- Experiment with different widget types to find the best way to visualise your data.
- Use filters and conditions to refine your widgets and make them more relevant.
- Review and update your dashboard as your business needs evolve.
By following these steps, you will have a fully customised dashboard that gives you quick access to the information you need to run your business effectively.