


Table of contents
- What the site and funnel analytics dashboard is
- Key benefits of site and funnel analytics
- Key metrics in site and funnel analytics
- Select the asset type
- Filter by date range and asset
- Filter by specific asset (optional)
- Filter by date range
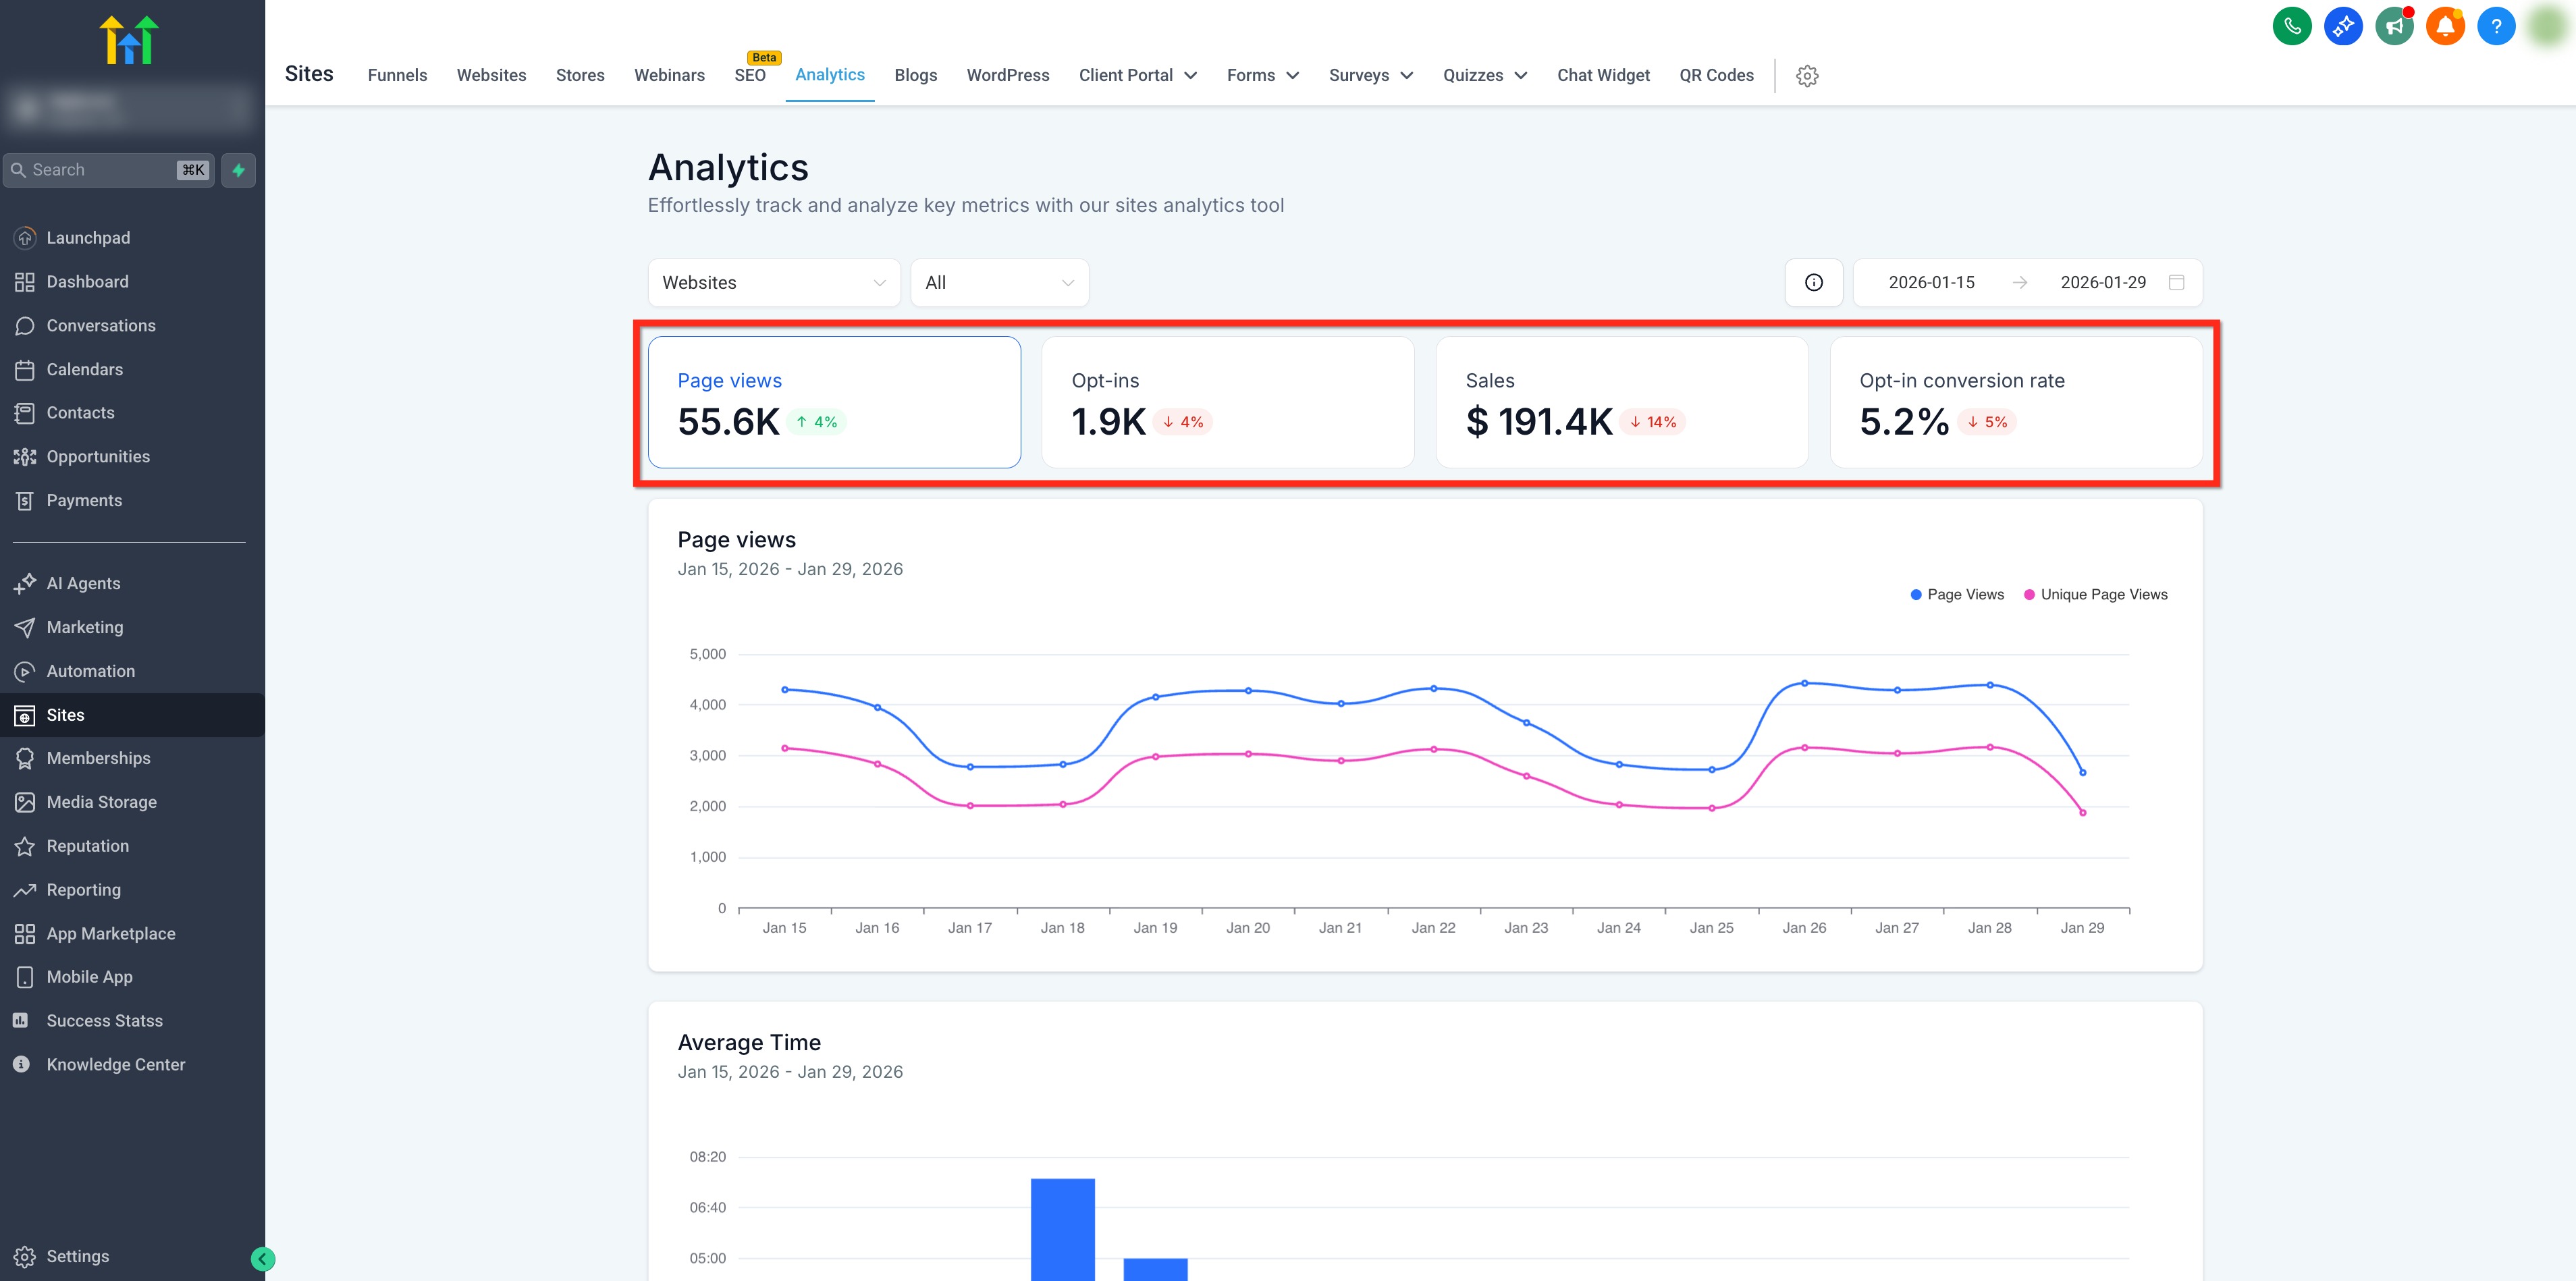
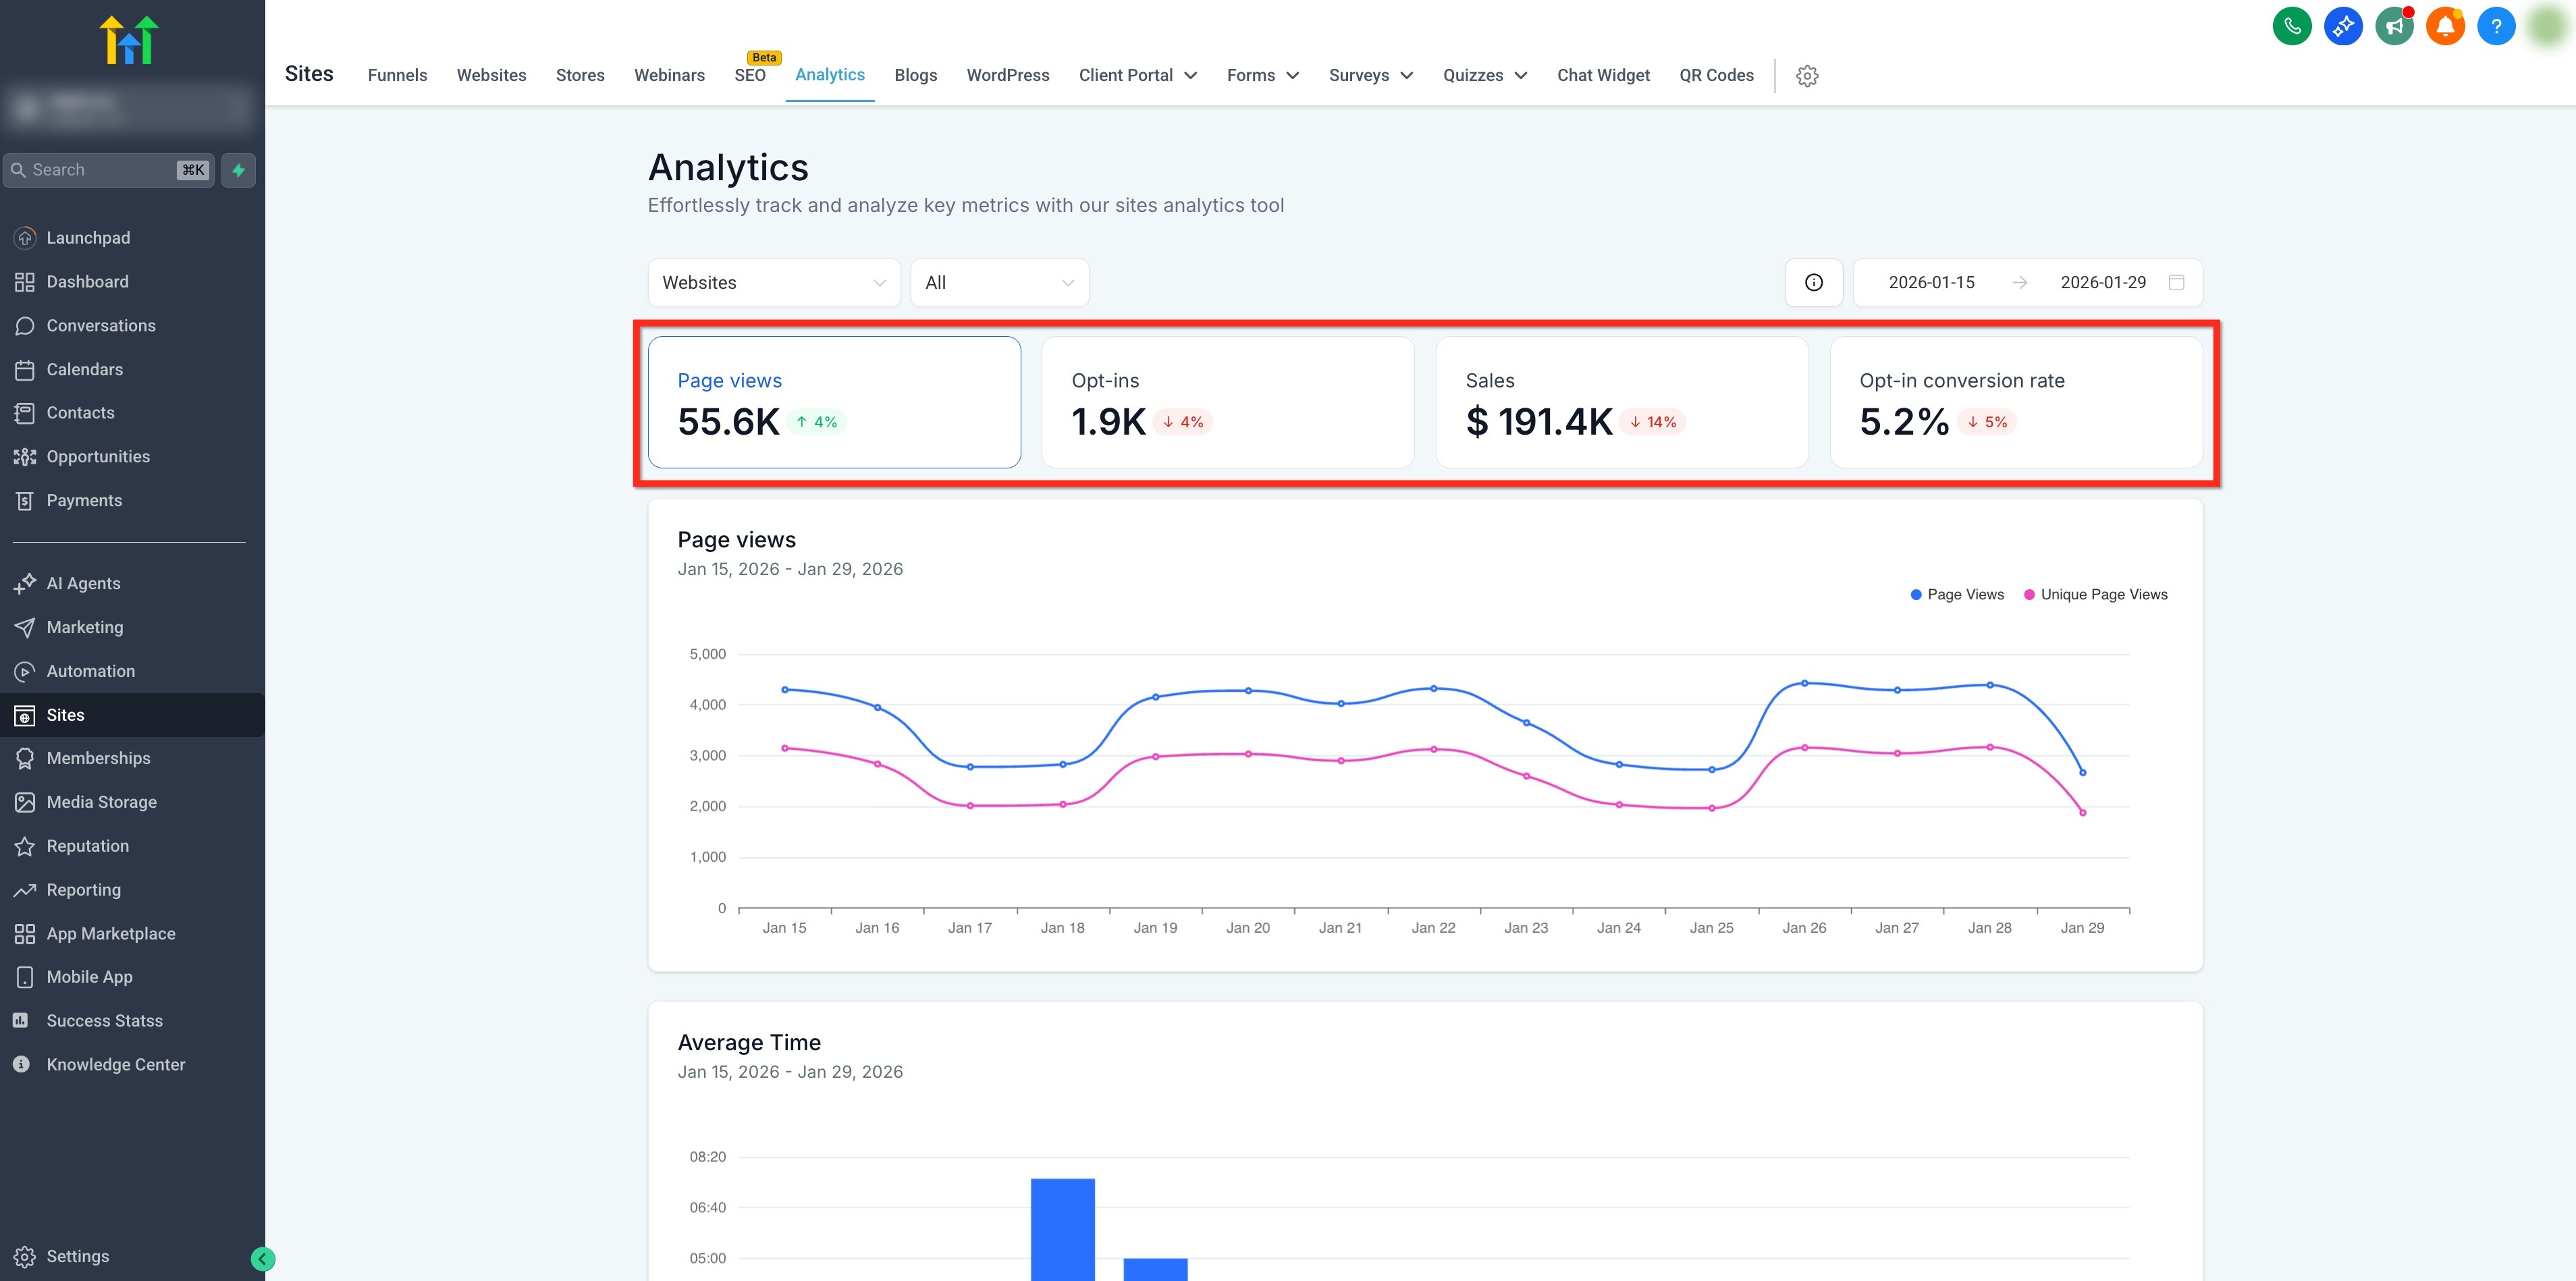
- Interactive KPI cards
- How to use site analytics
- Frequently asked questions
What the site and funnel analytics dashboard is
The site and funnel analytics dashboard is the central place to measure how your web assets attract, engage and convert visitors. It gives you a single point of reference for reviewing KPIs and charts without having to jump between one funnel, page or tool and another.
You can choose an asset type to analyse (such as funnels or websites), optionally narrow things down to a specific asset and set a date range. The dashboard summarises the results with KPI cards and clear charts. Because the KPIs and charts are tailored to the asset type you select, the view stays focused on the metrics that matter most while still giving you a quick route to deeper analysis.
Key benefits of site and funnel analytics
This feature is designed to save you time and effort, letting you concentrate on what matters most: growing your business.
- Intuitive interface: navigate your data with ease, thanks to our simple, clear design.
- Actionable data: make informed decisions to optimise your funnels and websites and get better performance.
- Efficiency: identify trends and patterns quickly without the hassle of collecting the data manually.
Key metrics in site and funnel analytics
- Page views: see how many times a funnel, website or other asset has been visited, including data on unique page views.
- Page views by step: click a funnel, website or webinar in the page views chart to analyse performance at individual step level.
- Opt-ins: the number of conversions in your funnel/website (for example a product purchased, a form/survey submitted or an appointment booked).
- Time on page: how long the user stays.
- Sales: the revenue generated by your funnel/website.
- Opt-in conversion rate: the ratio of opt-ins to unique page views.
For more information on metric definitions, see: Funnel and website statistics definitions.
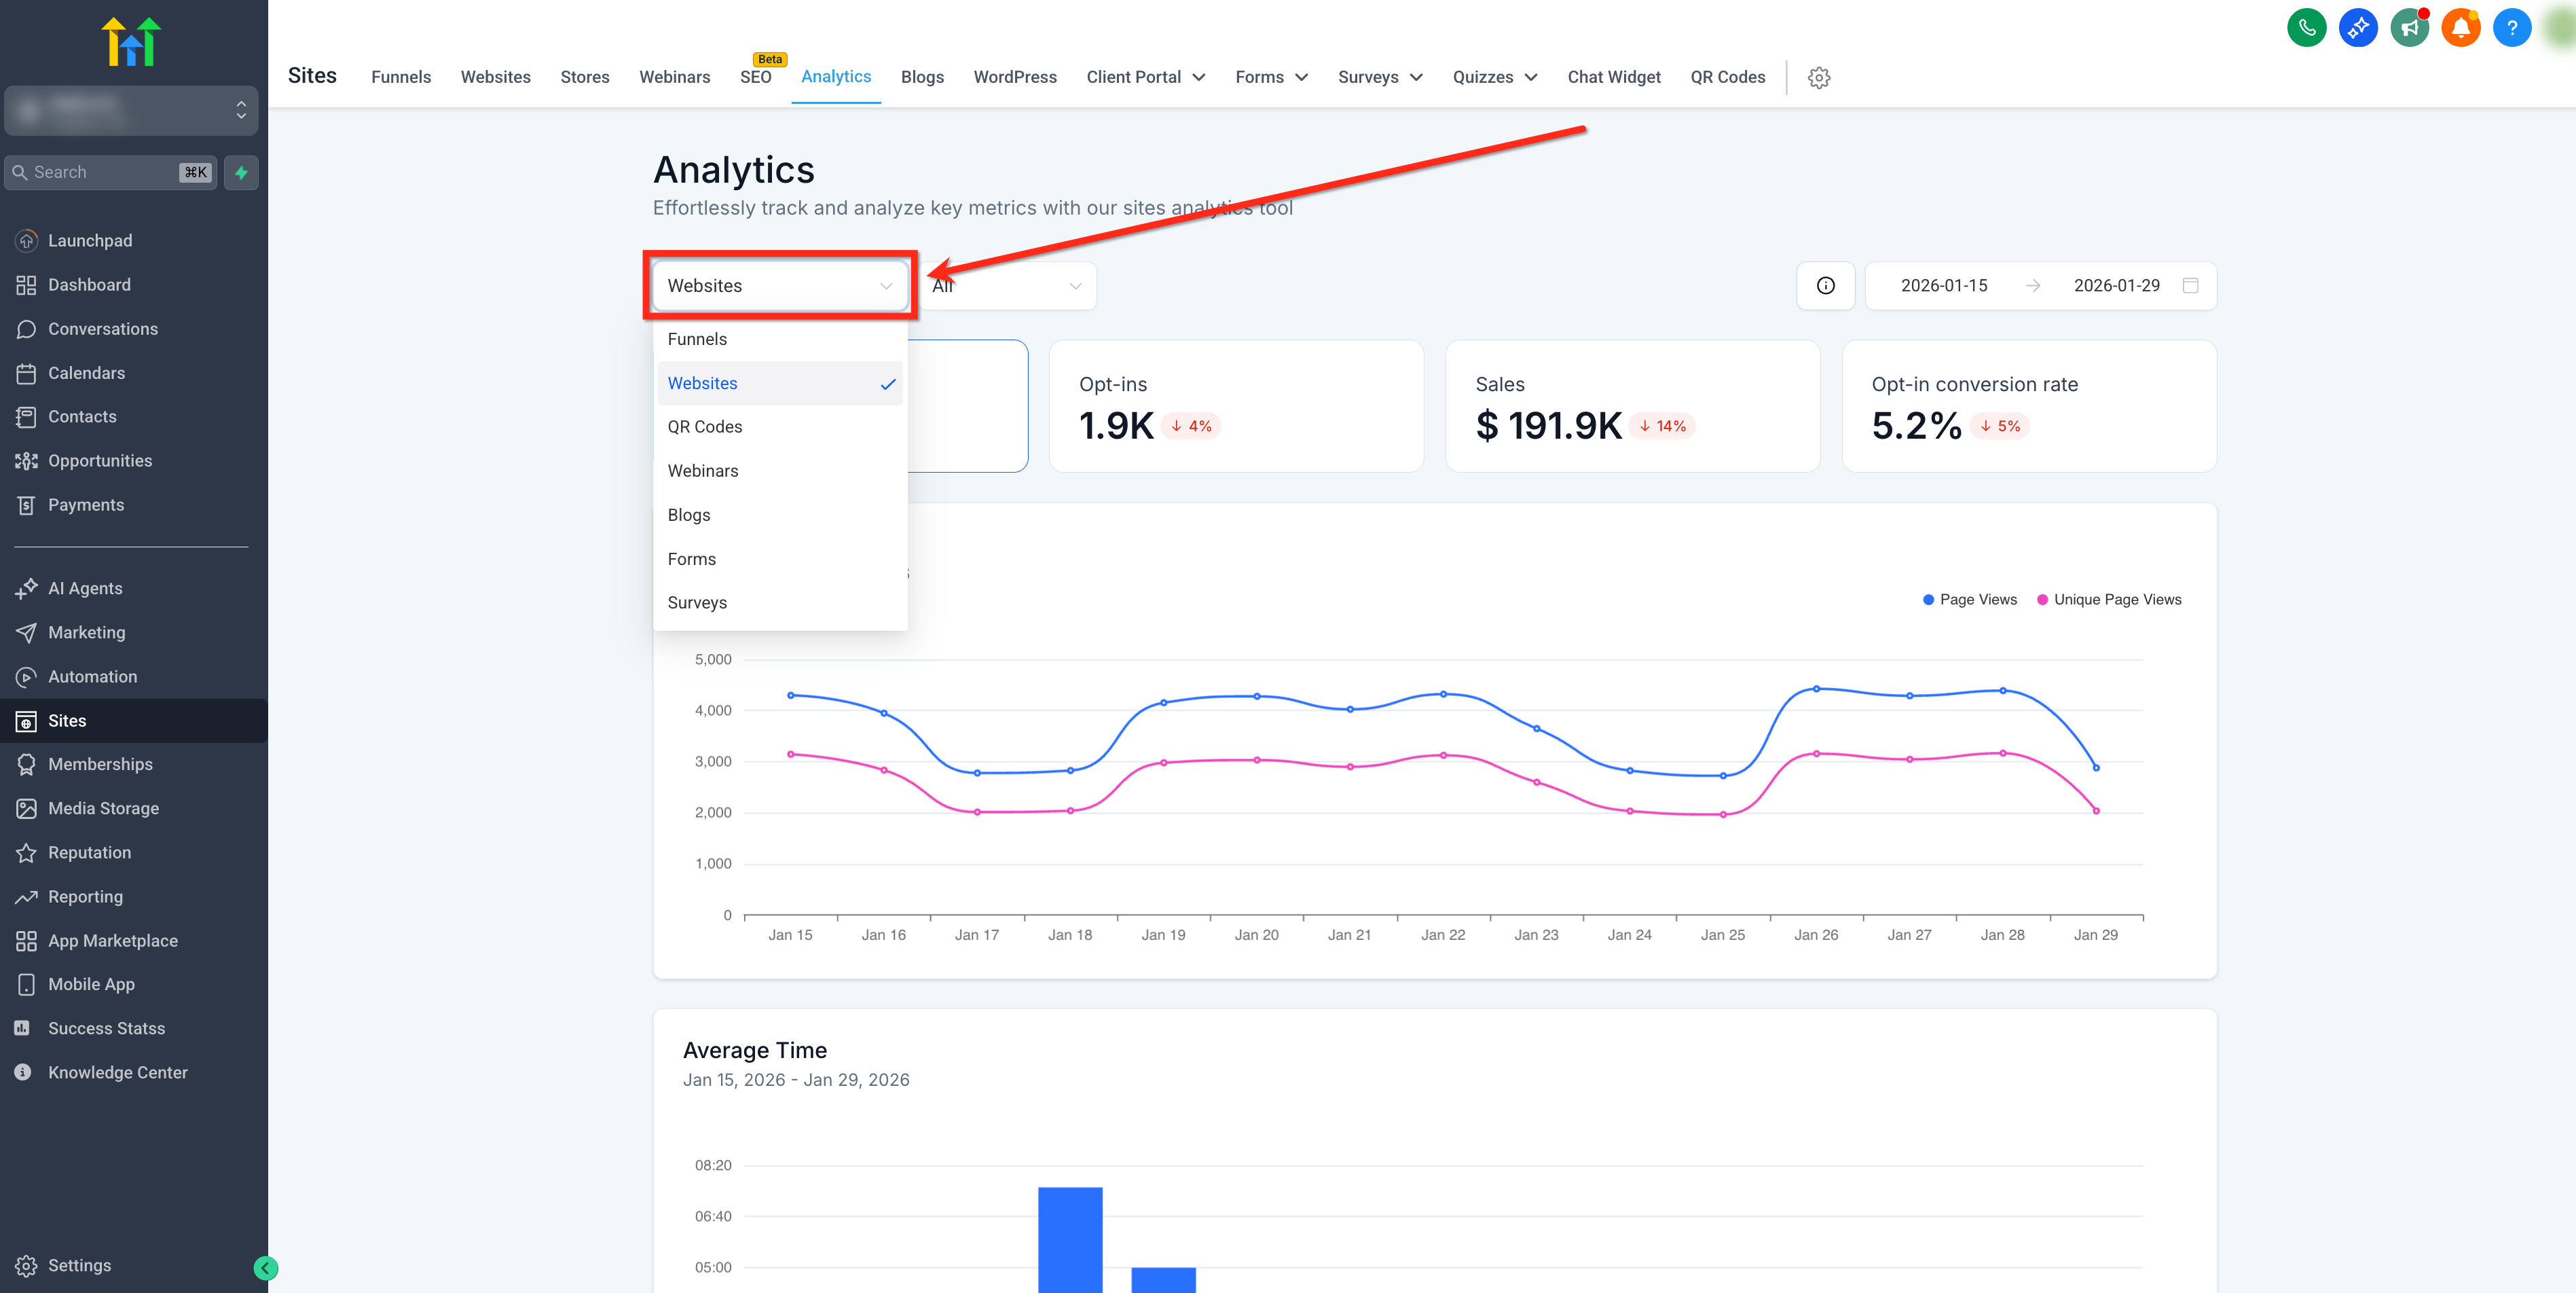
Select the asset type
Start by choosing the family of assets you want to analyse. This selection is required and you can have only one asset type active at a time. Your choice determines which KPI cards and charts are displayed in the dashboard.
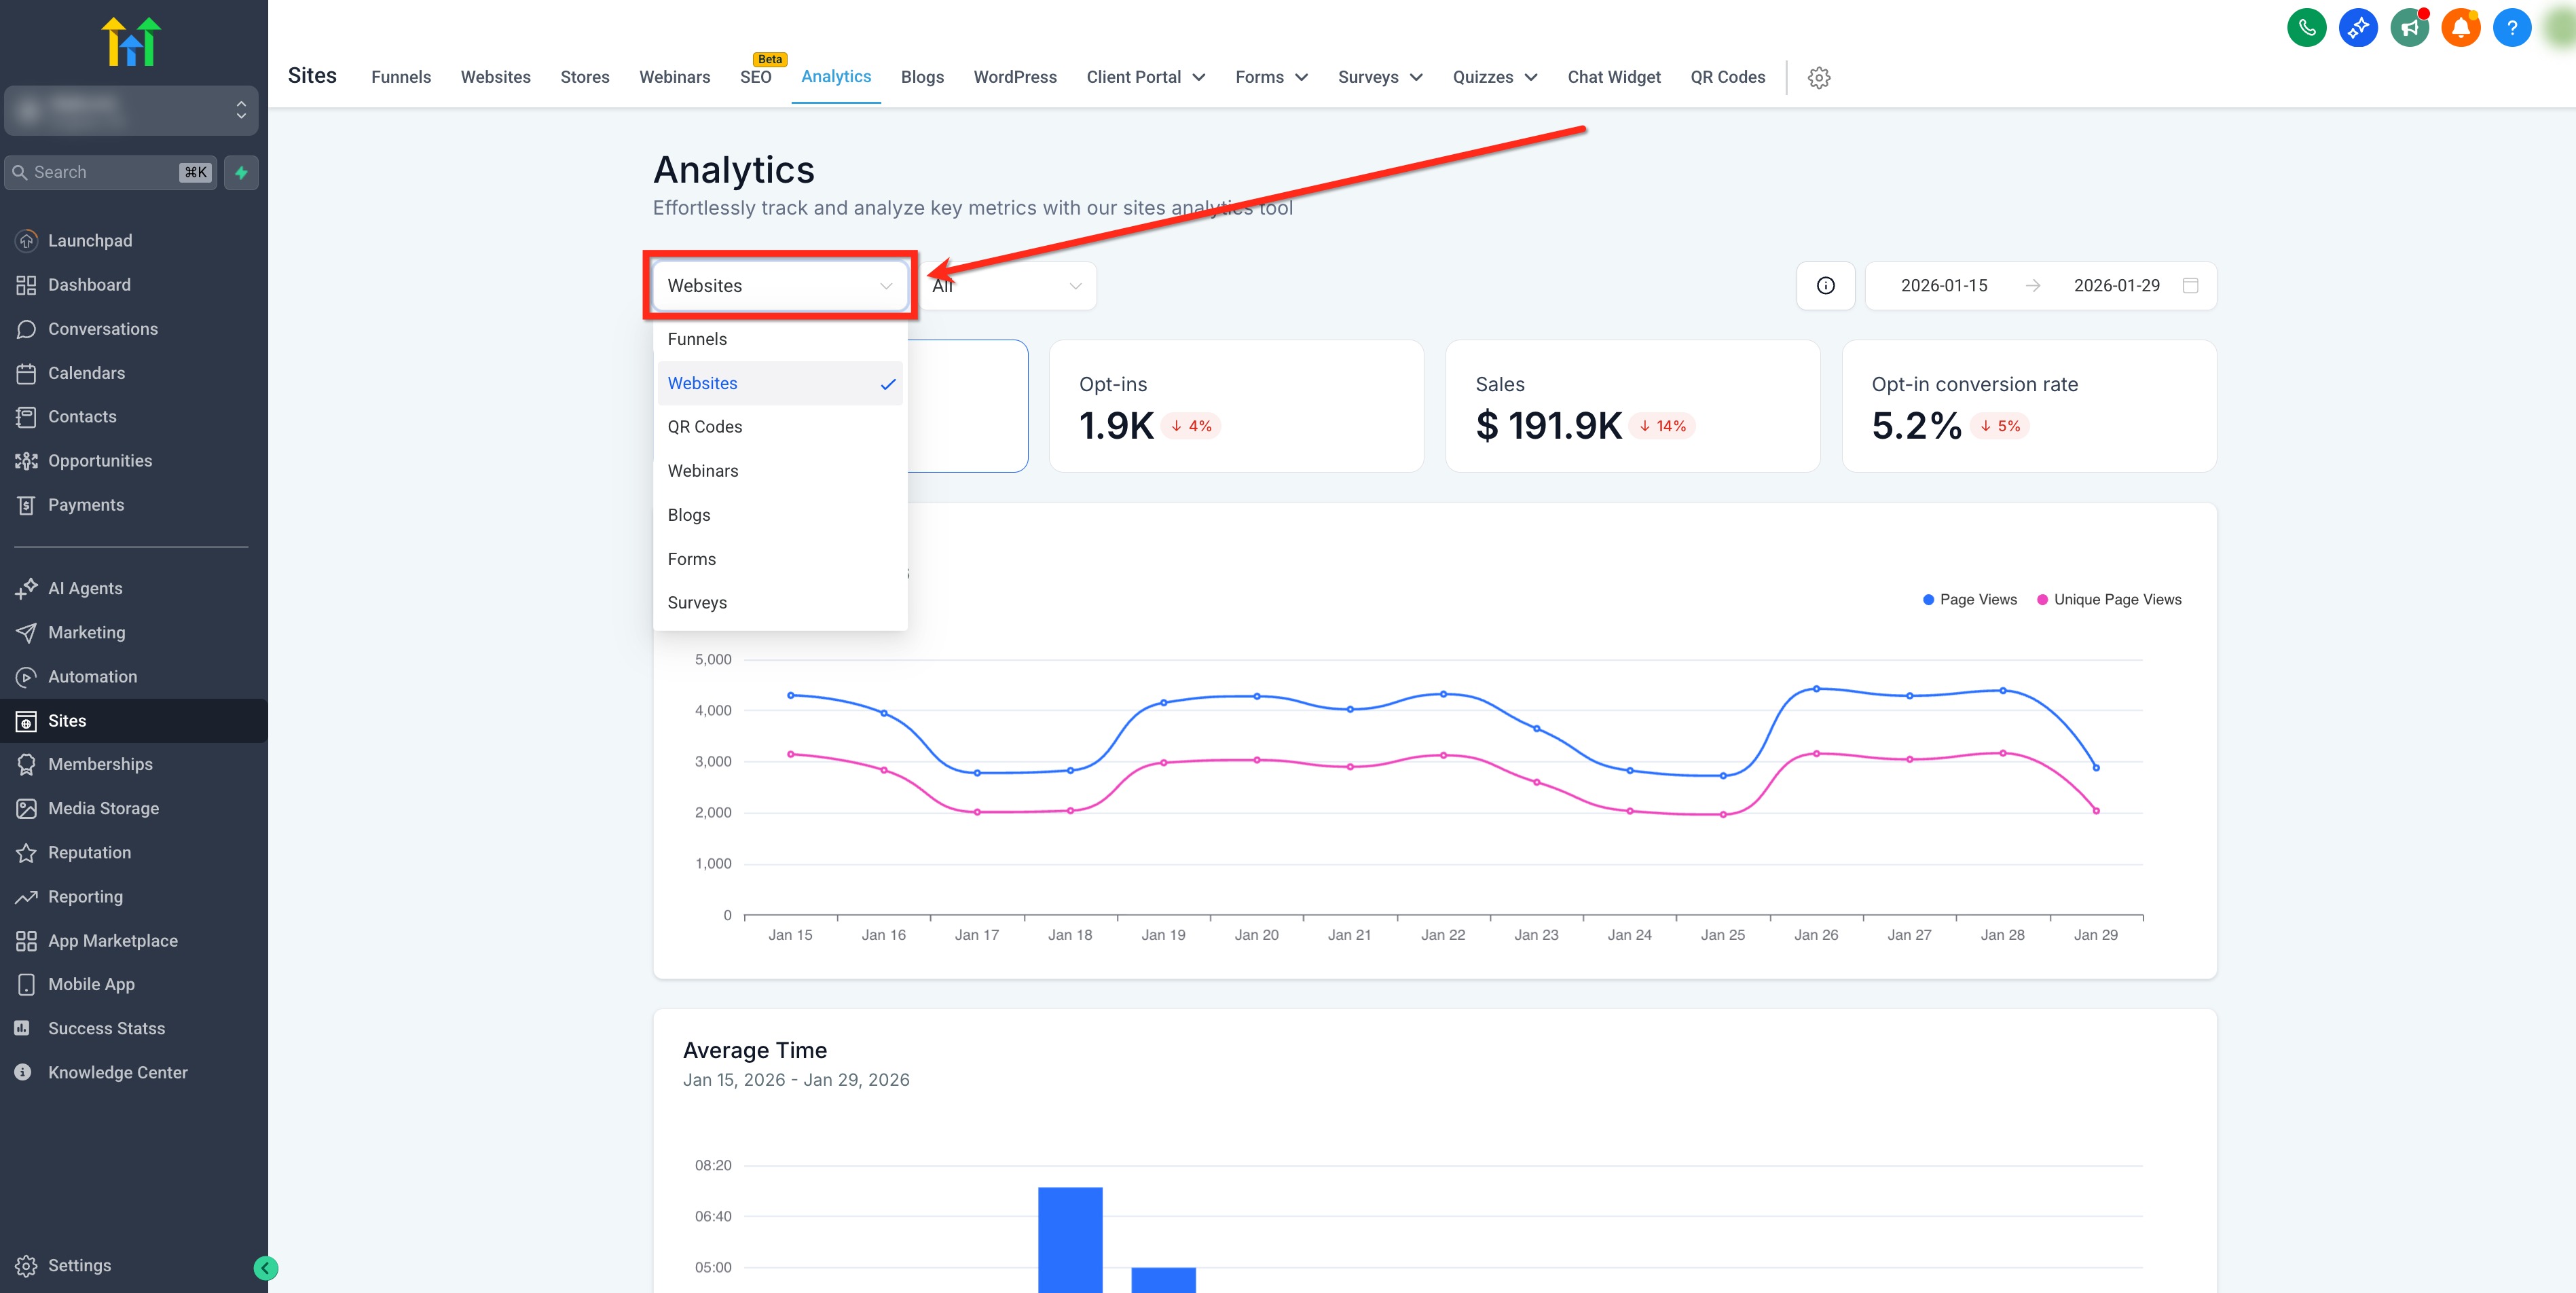
Use the drop-down menu to choose an asset type from the following options: funnels, websites, blogs, webinars, forms, surveys, QR codes or external tracking.
Note: the metrics shown in the dashboard change according to the asset type you select.
Filter by date range and asset
Focus your analysis by applying two filters: choose a specific asset and set a date range.
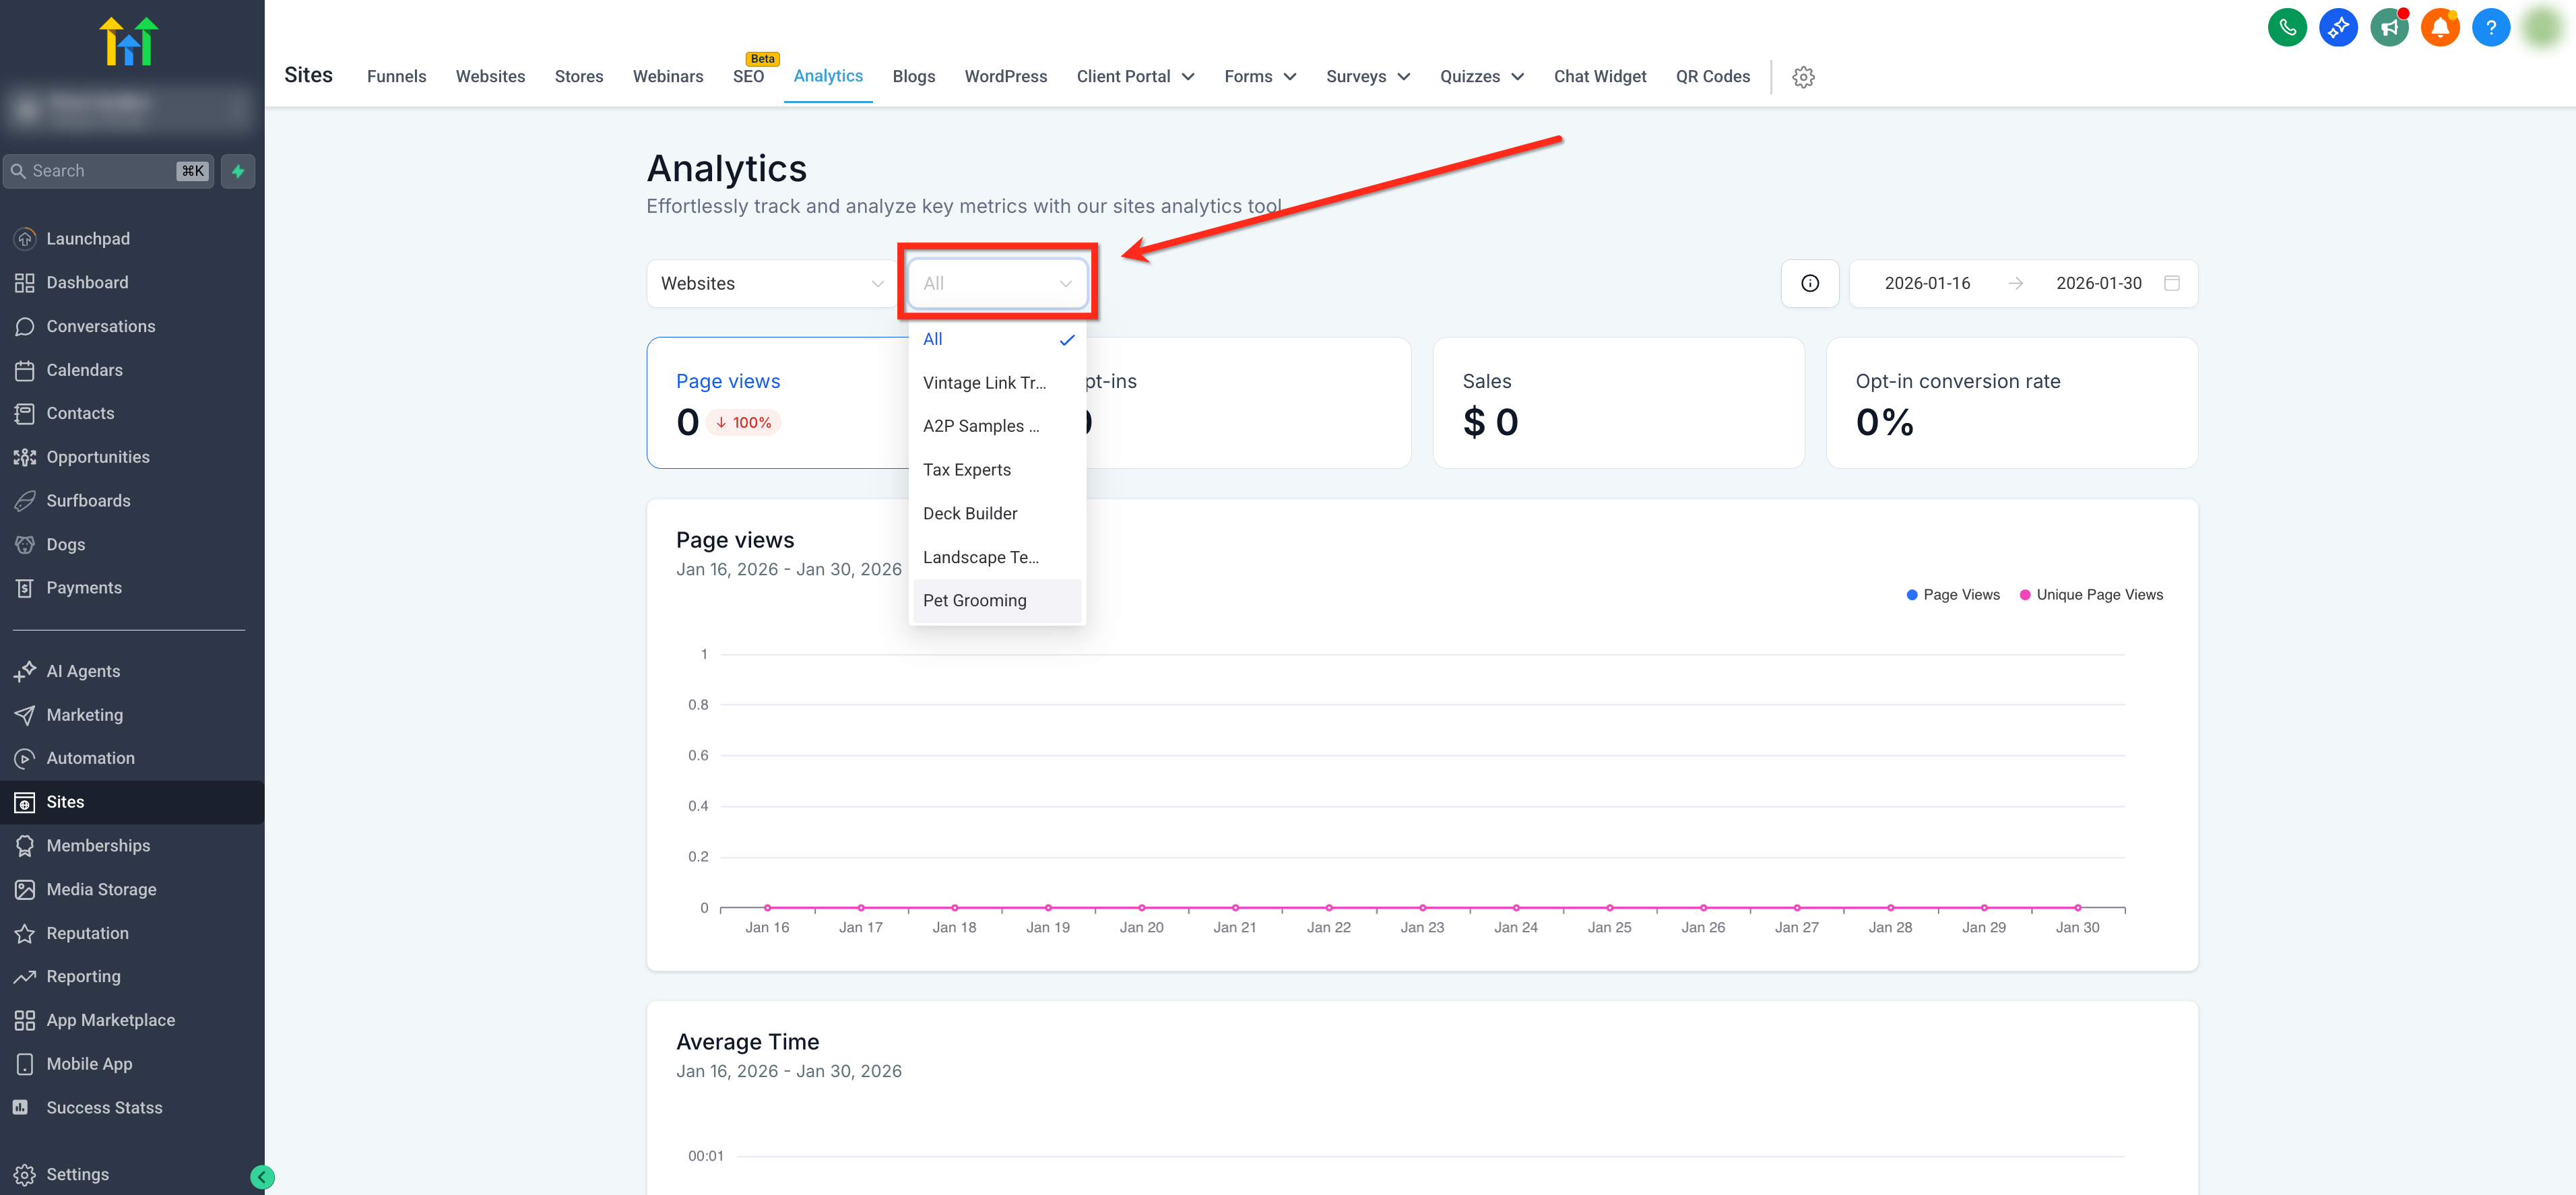
Filter by specific asset (optional)
Choose a single asset within the currently selected type (for example a specific funnel, website, blog, webinar, form, survey or QR code). If you leave the setting on All, the results will be aggregated across every asset of that type. If you change the asset type, this filter will reset to "All".
Filter by date range
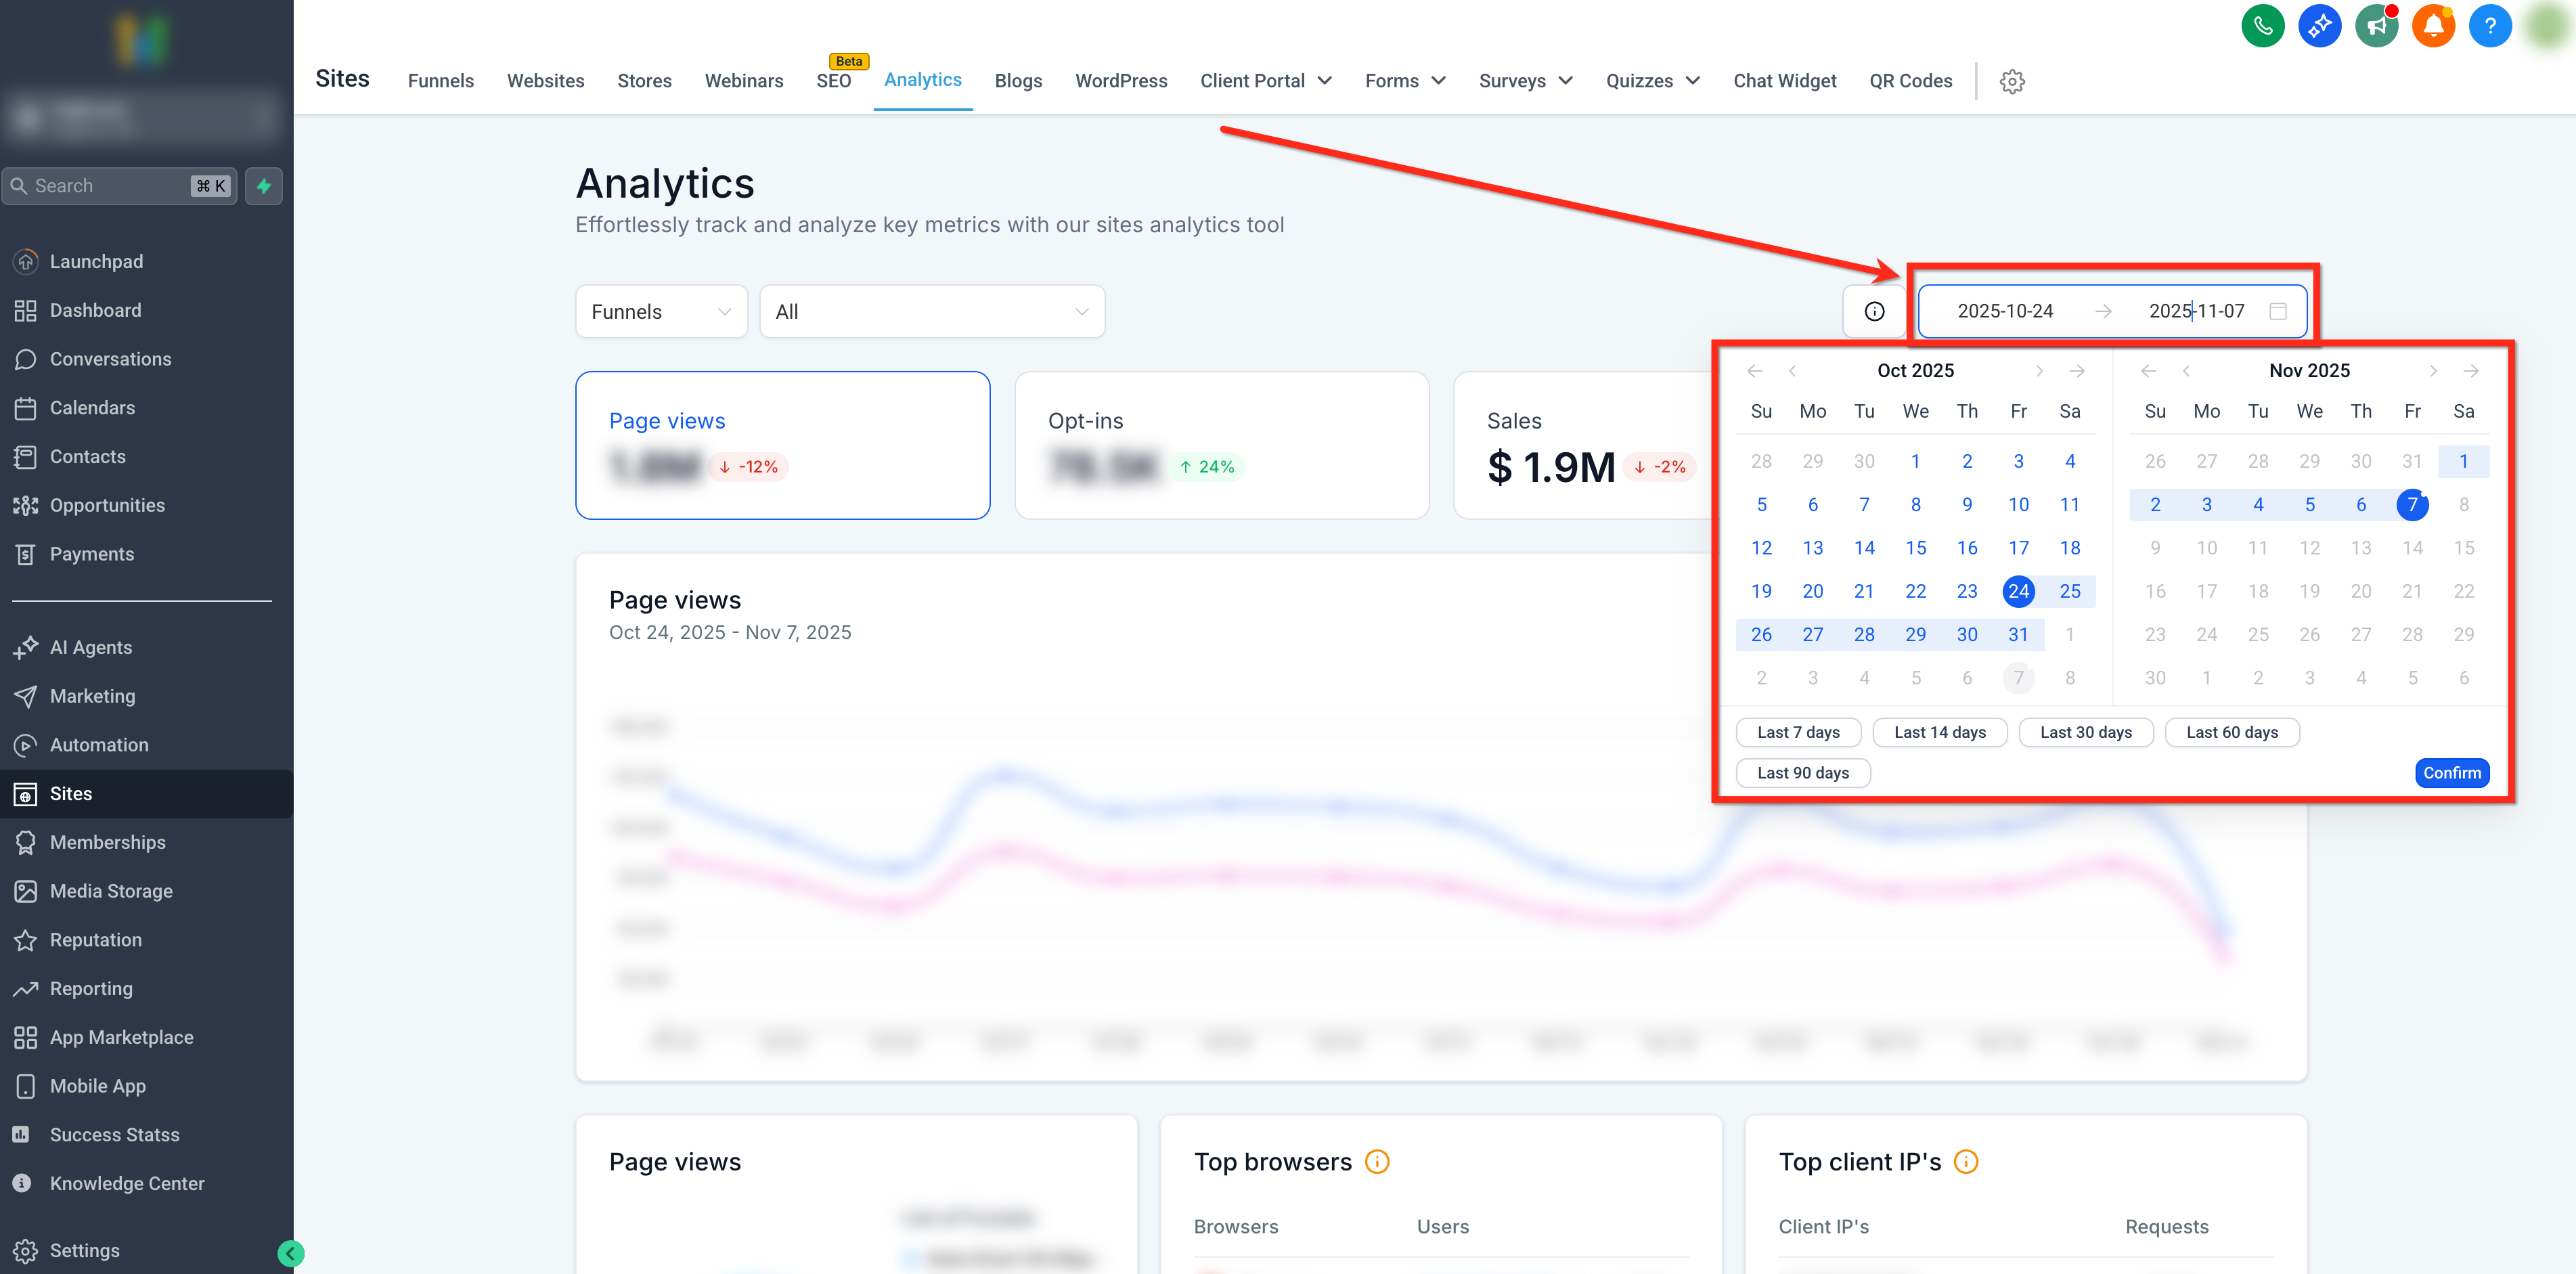
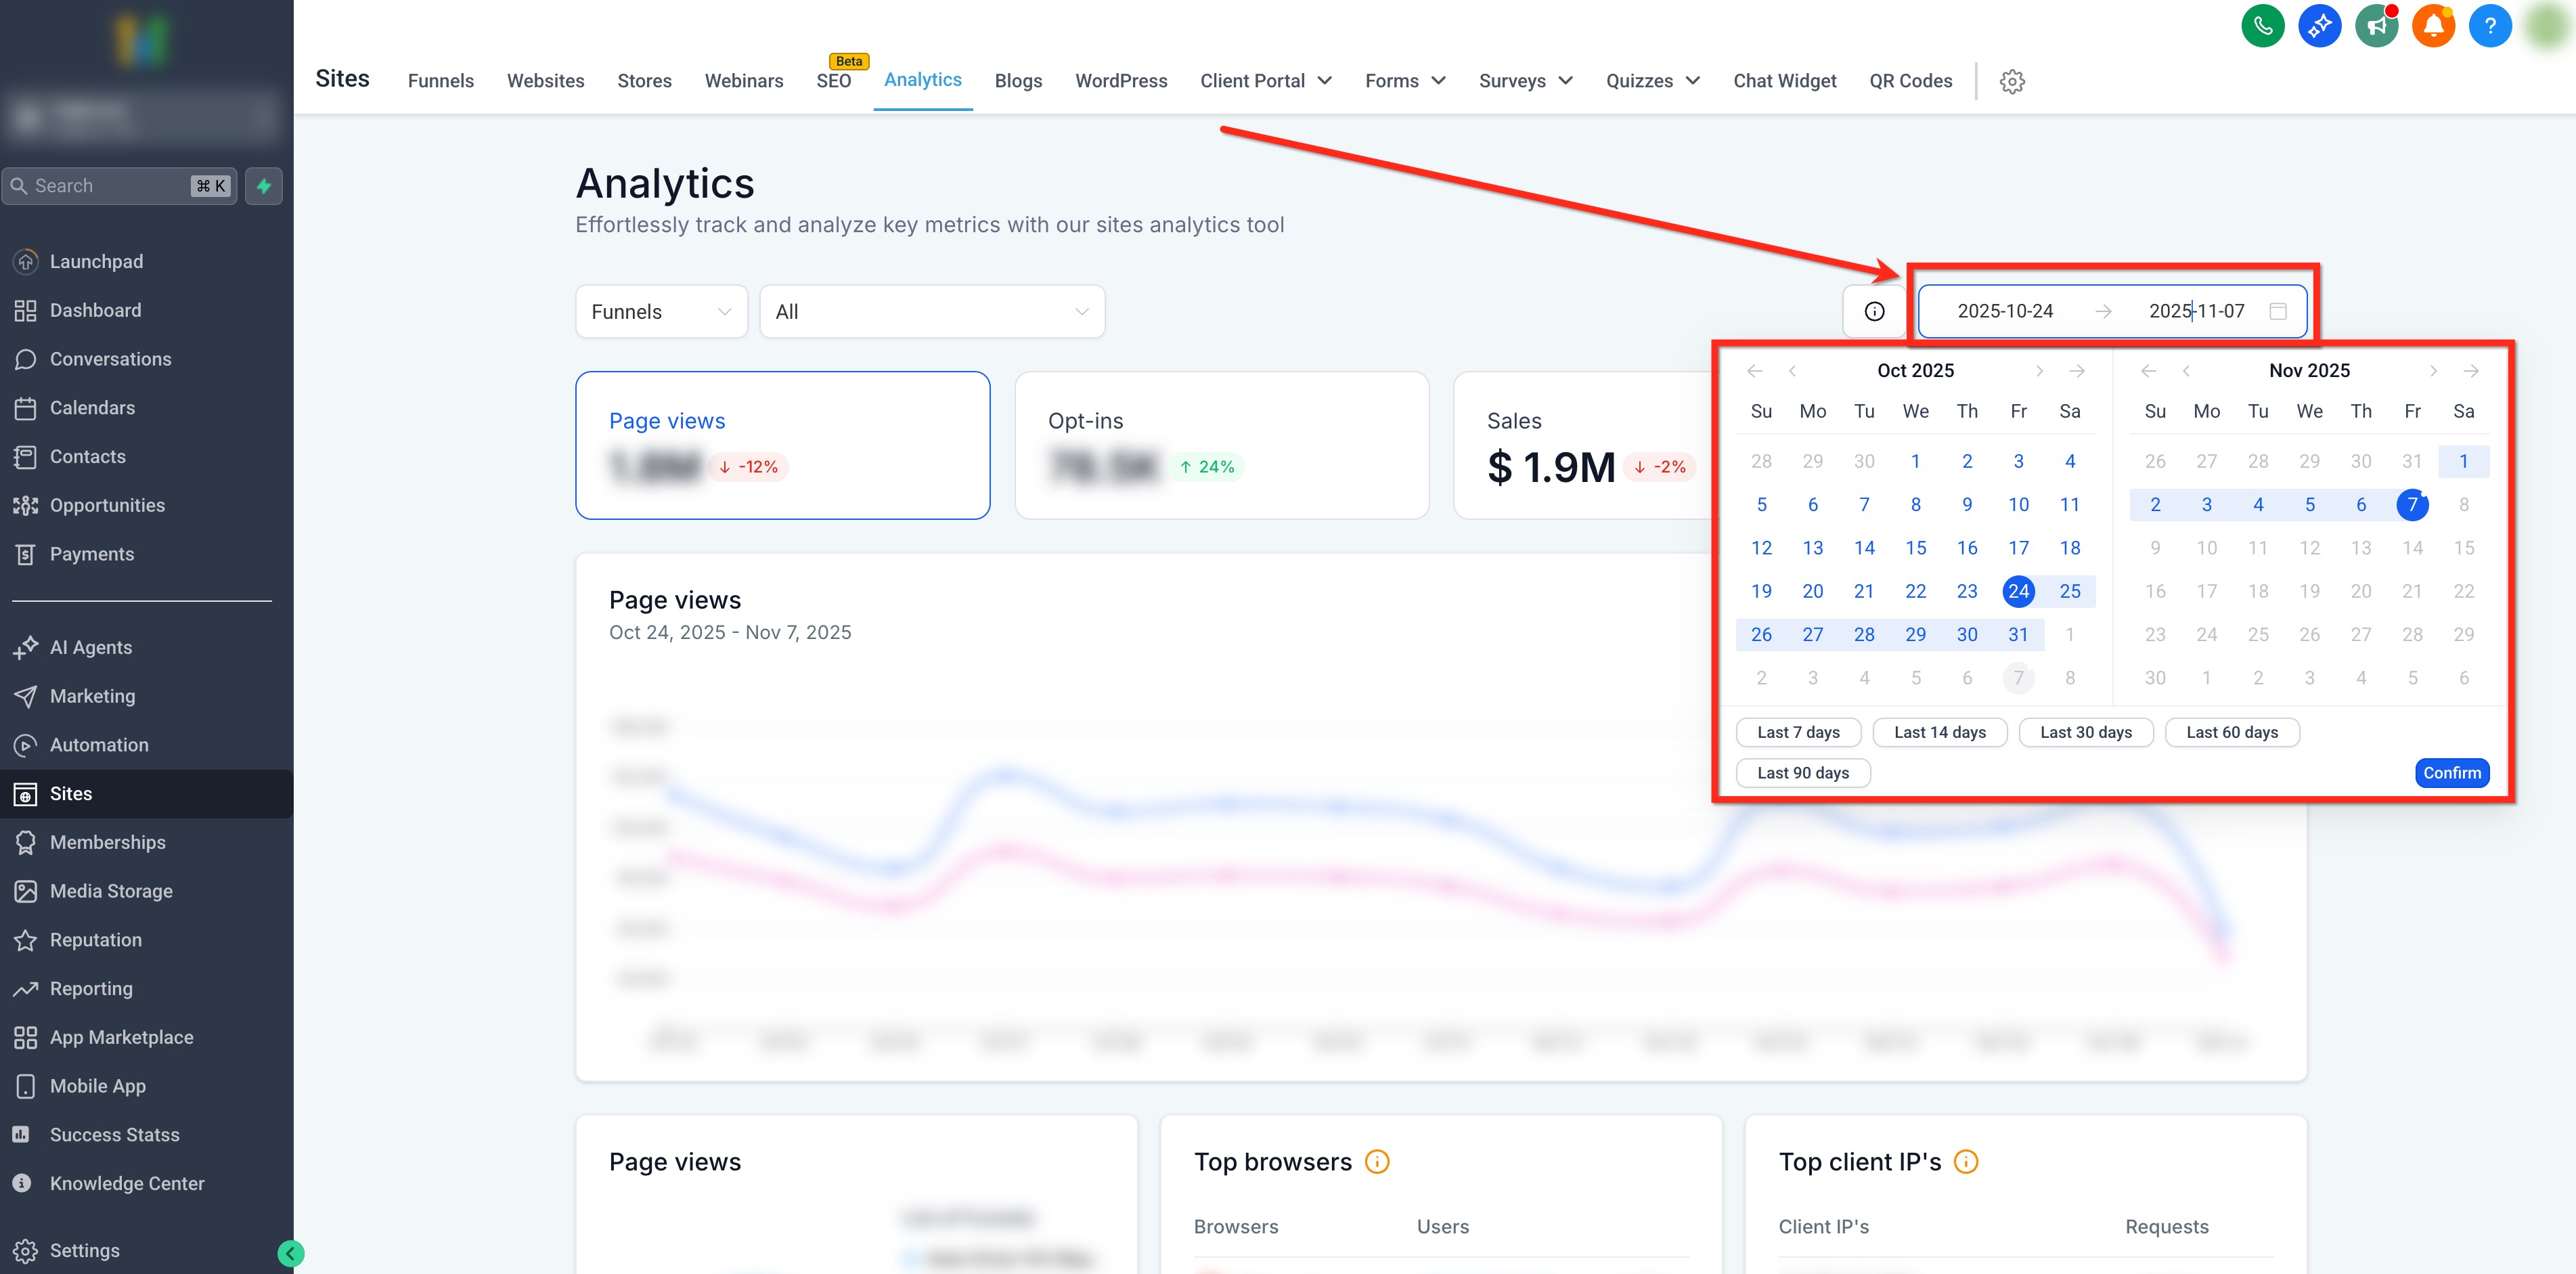
Use the date range selector in the top right to choose a time period and filter the data. This lets you view detailed timelines of page views, opt-ins, sales and order conversion rates for the period you choose. The dashboard compares the data for this period with the previous period of the same length.
The default date range is Last 14 days.
Interactive KPI cards
The KPI cards work like tabs. When you select a KPI card, the charts and analysis below update to explore that metric in detail. Some asset types have fewer (or no) KPI cards.
Note: the metrics shown in the dashboard change according to the KPI card you select.
How to use site analytics
Step 1: Go to the Analytics section
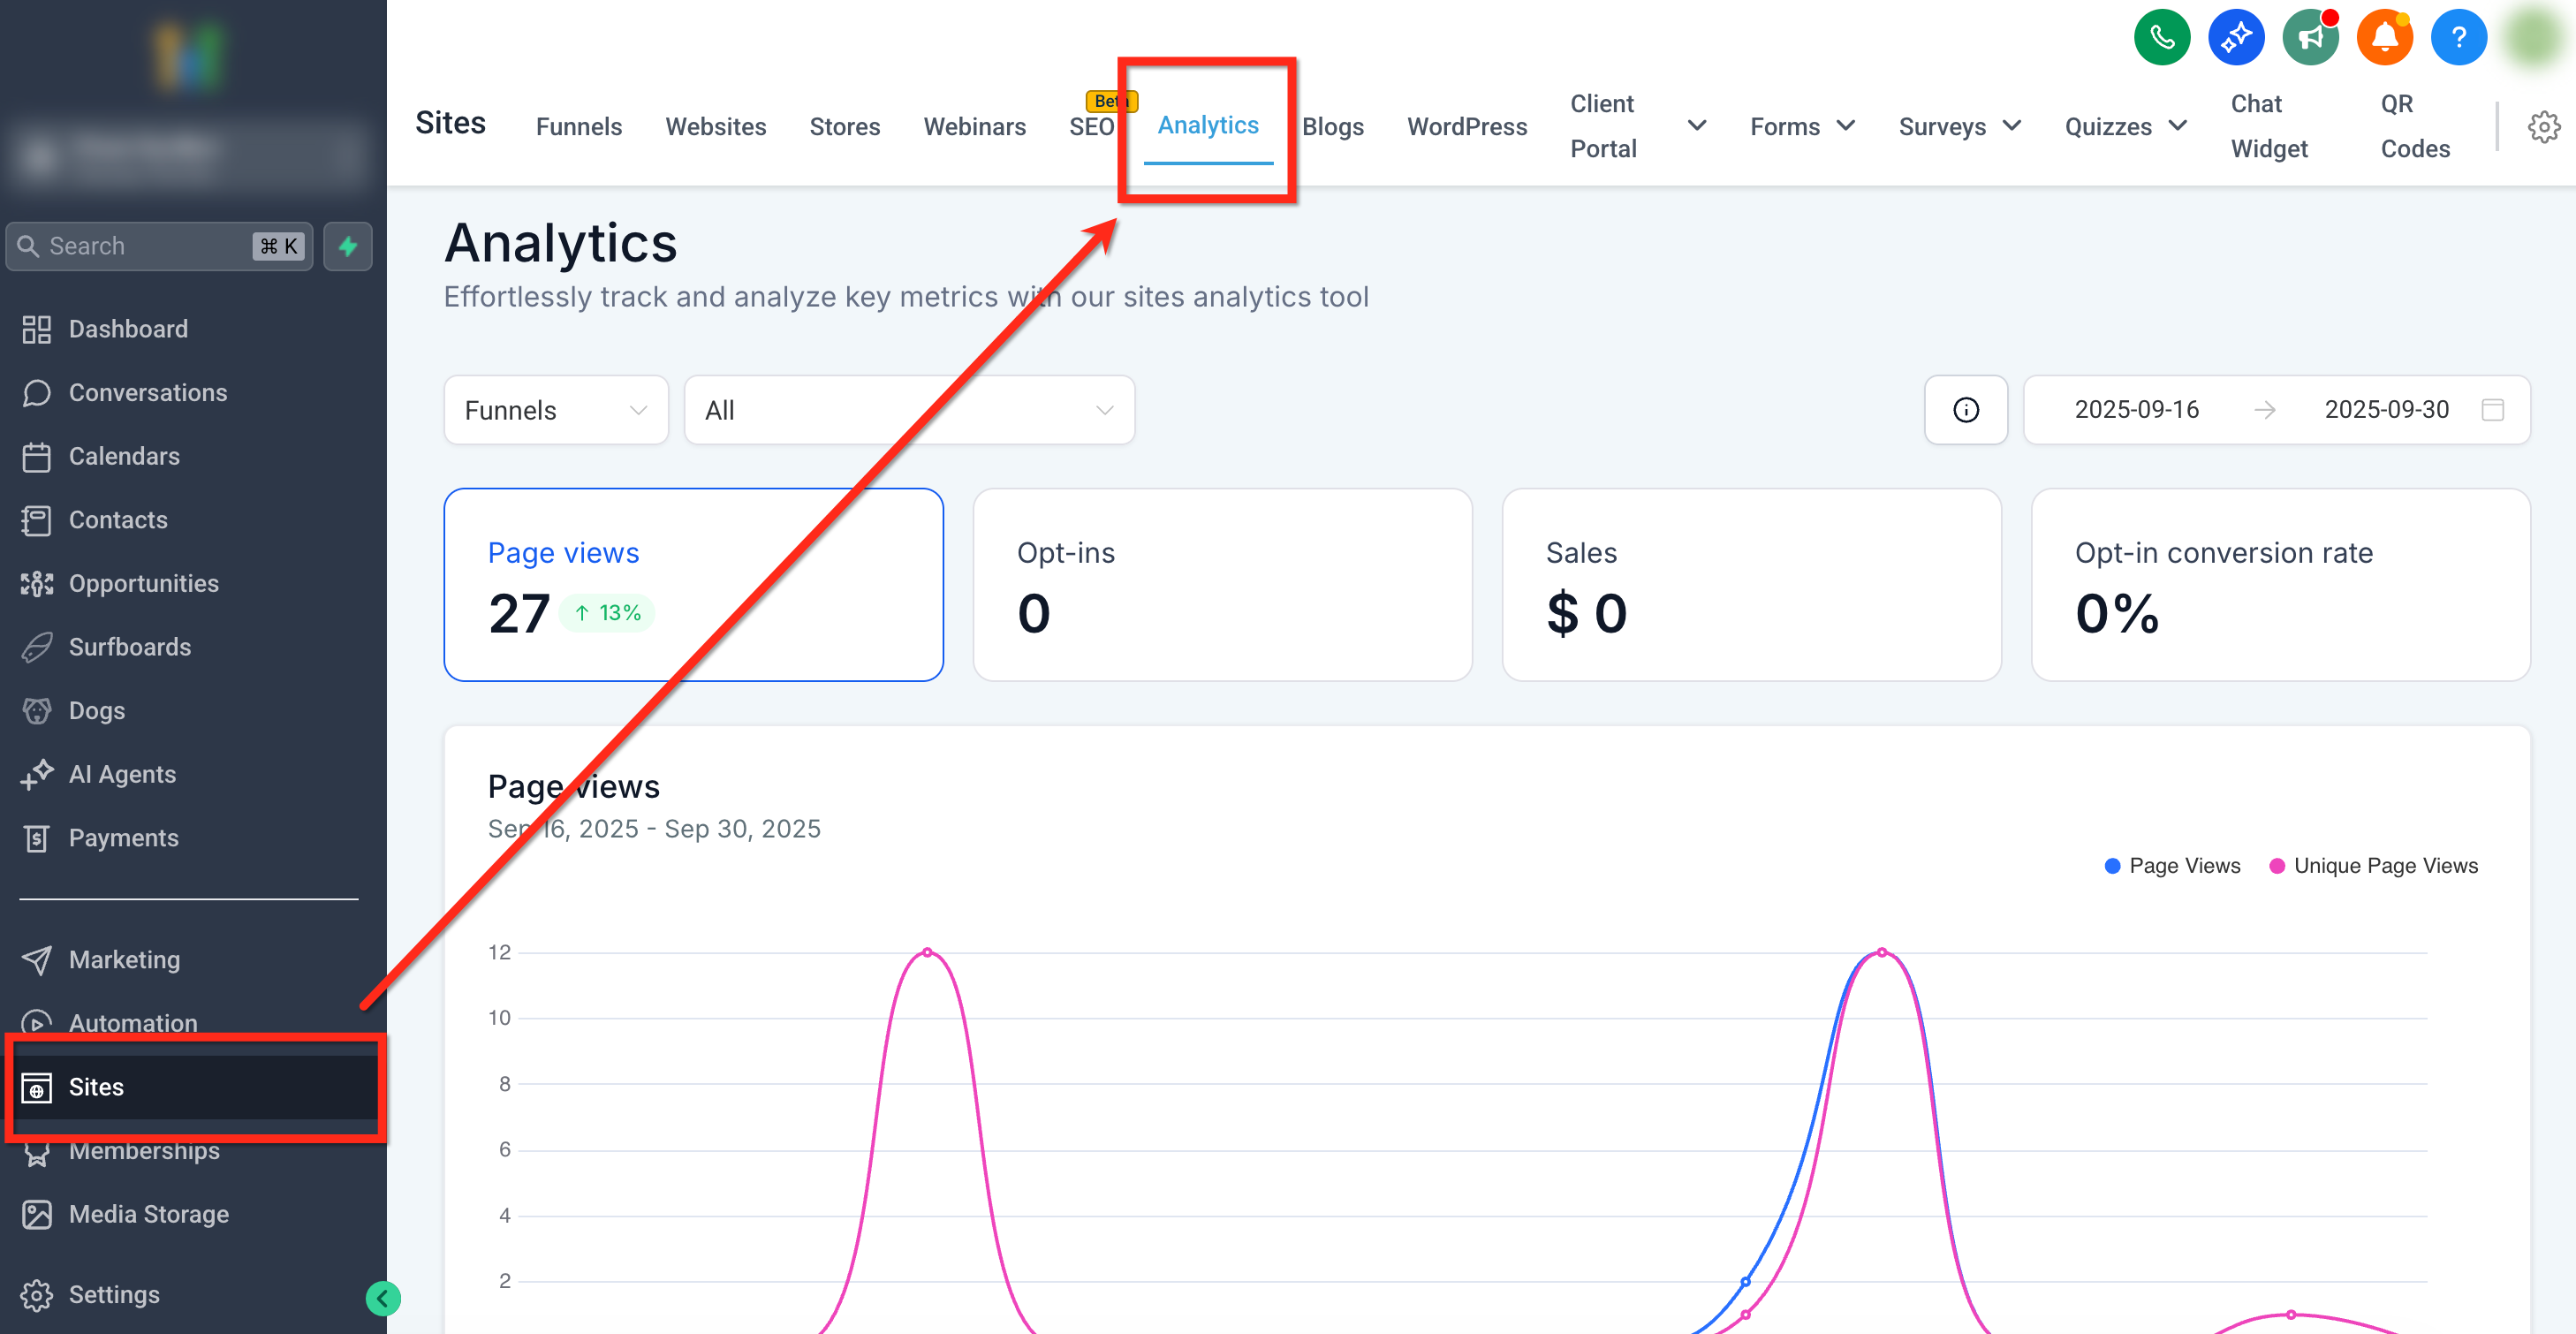
From your account dashboard, use the left-hand navigation bar to go to Sites. Select the Analytics tab in the top navigation menu.
Step 2: Select the asset type
Use the drop-down menus to select an asset type (for example funnels) and, optionally, choose a specific asset to narrow things down.
Step 3: Set the date range
Choose a date range that matches your analysis goals.
Step 4: Explore your data
Click the KPI cards to change the focus of the charts and analyse trends and data breakdowns. Repeat as needed for other asset types, specific assets or time periods.
Frequently asked questions
Q: Why can't I see the KPI selectors for QR codes?
QR codes provide a simplified view (total scans and scans per code). KPI card selectors are not available for this asset type.
Q: How is the previous-period percentage calculated?
The dashboard compares the selected range with the immediately preceding period of the same length (for example the last 14 days against the previous 14 days).
Q: What affects data availability for external tracking?
The external tracking script must be installed and working on the external site. If it is missing or blocked, views/submissions will not be recorded.
Q: Can I see page views for a specific funnel step?
Yes, click an item in the page views chart to view performance and engagement metrics at individual step level.