


Table of contents
- What dashboard widgets are
- Widget categories:
- Filtering opportunity widgets by a specific sales pipeline
- Supported chart types:
- Using elements in your widgets
- Using different themes for the dashboard widgets
- Use cases for the different widgets
- Contact widgets:
- Appointment widgets:
- Opportunity widgets:
- Visitor data widgets (Websites/Funnels):
- Email widgets:
- Call widgets:
- Conversation widgets:
- Payment widgets:
- General widgets:
What dashboard widgets are
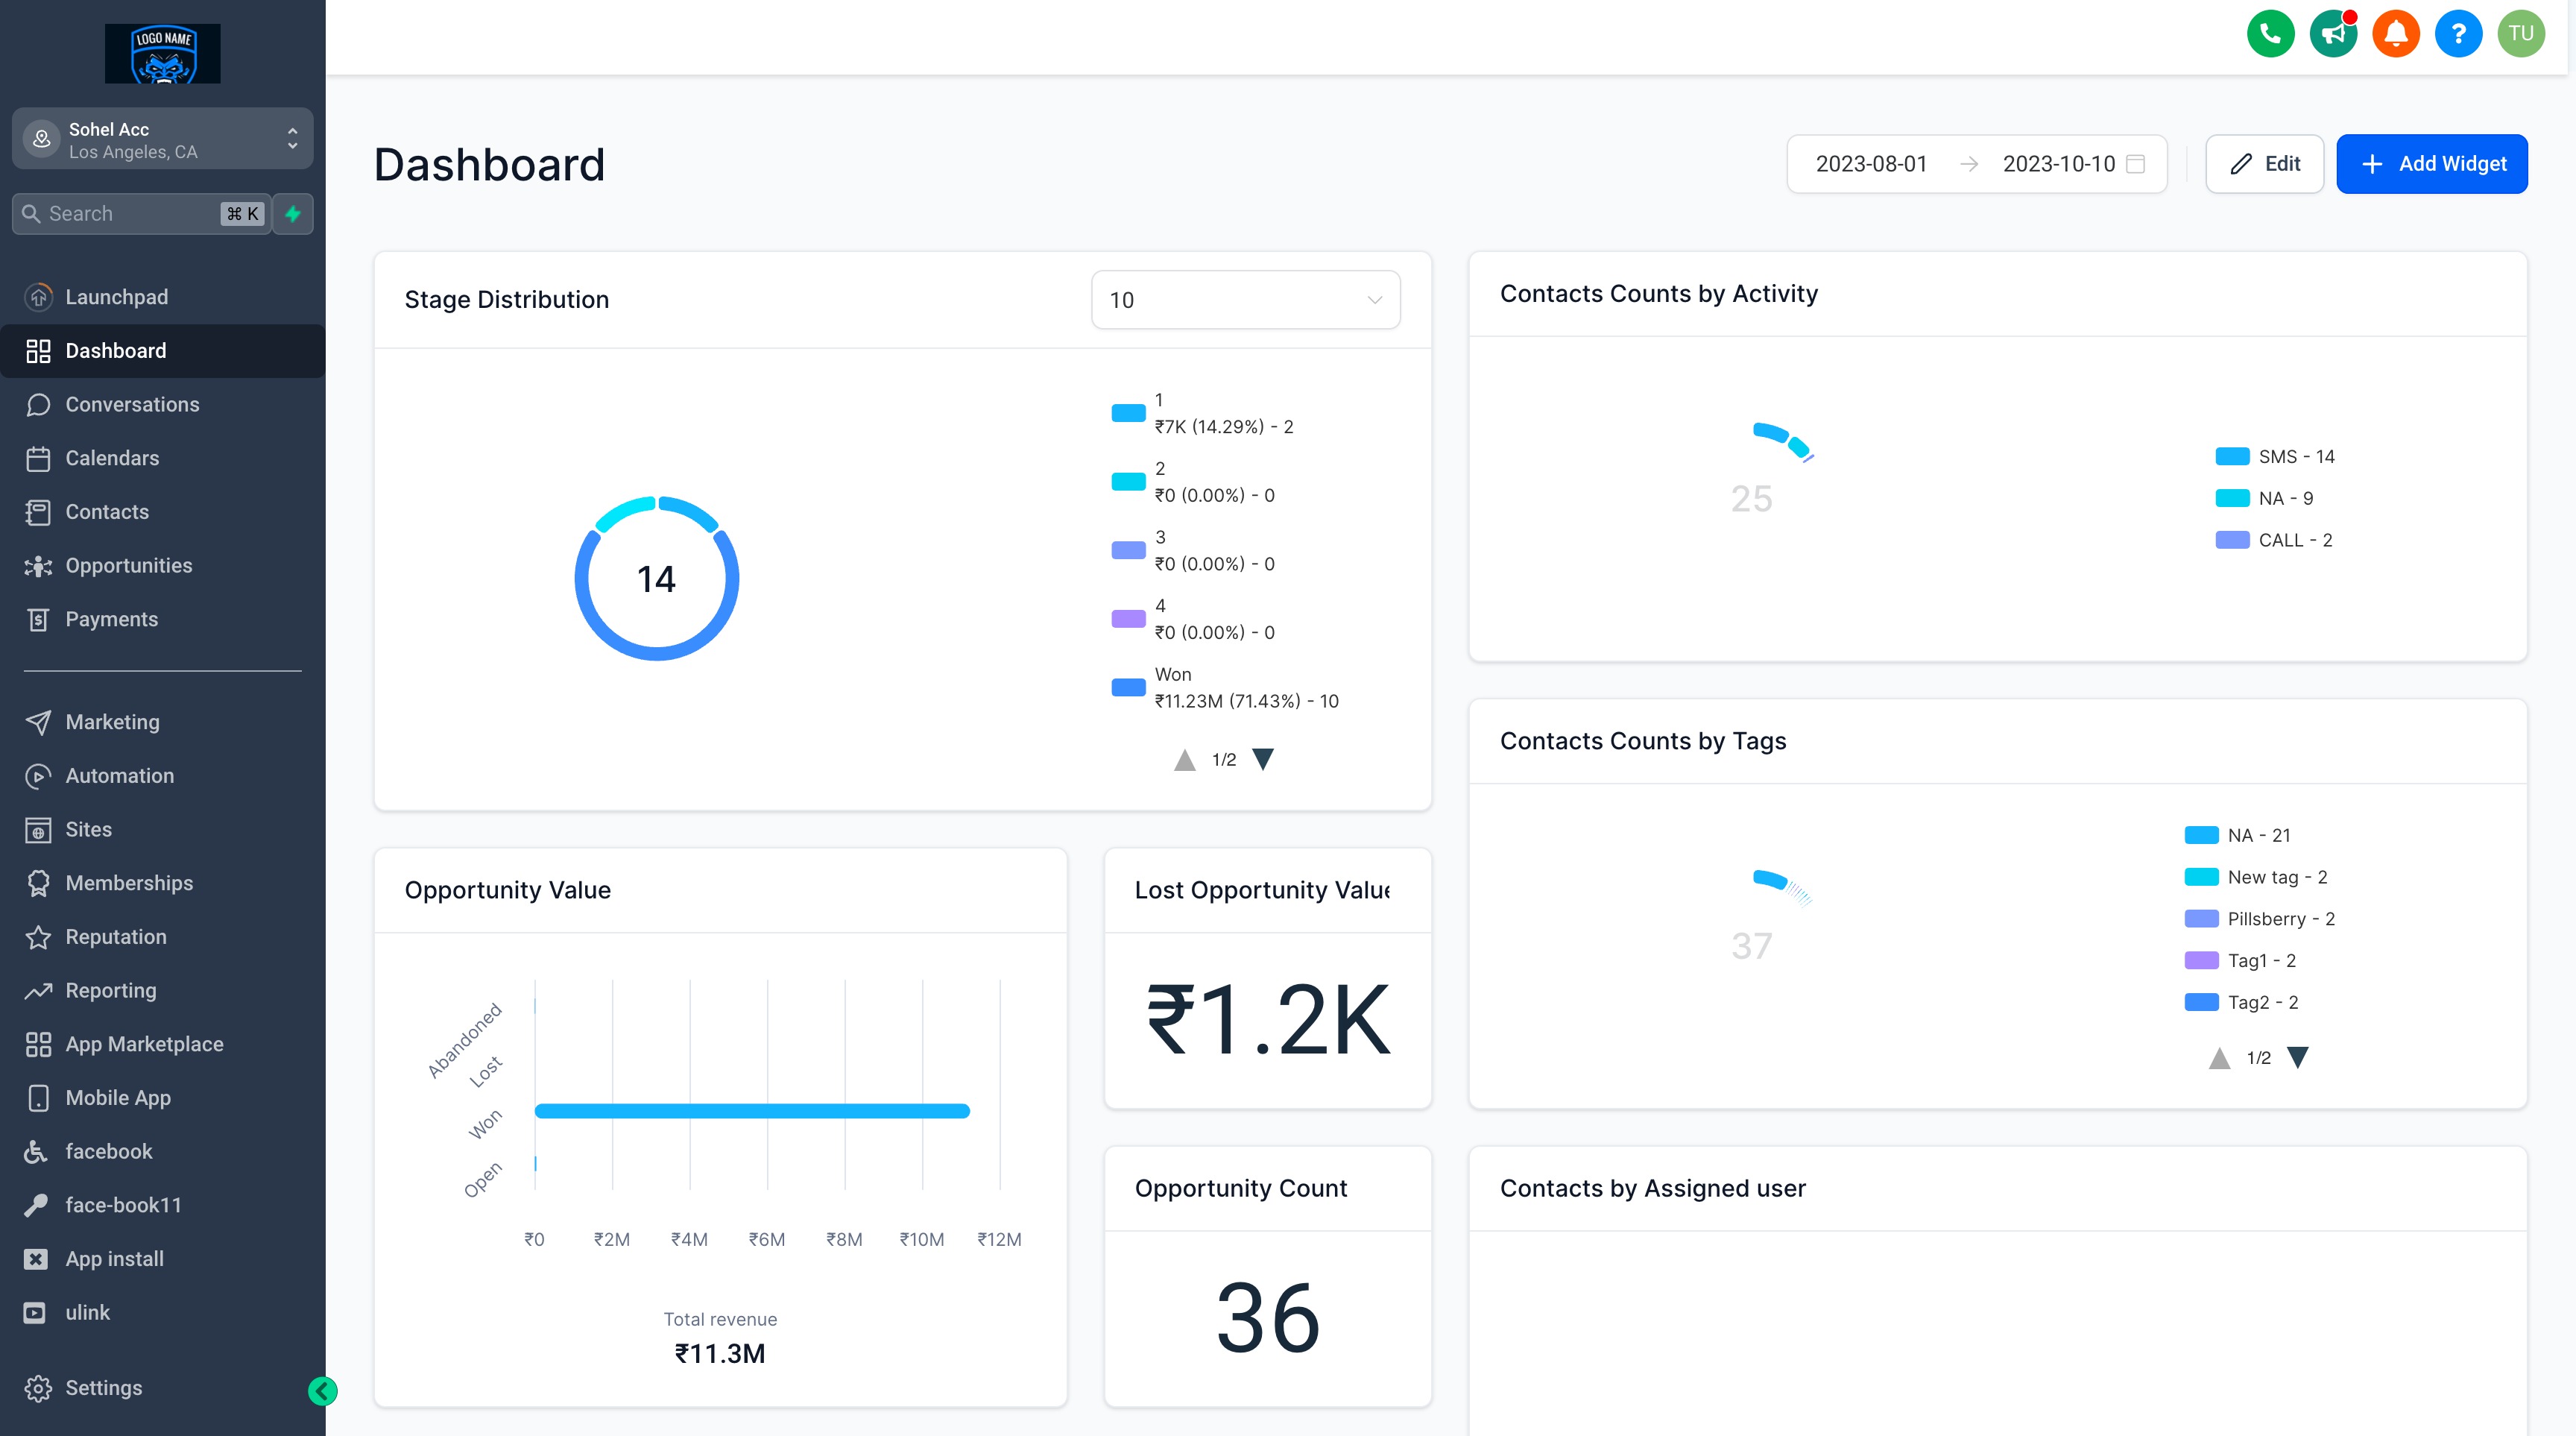
Dashboard widgets are versatile, customisable tools that make it easier to visualise and analyse your data. They give you quick access to key metrics, enabling efficient monitoring and advanced reporting.
Adding widgets to your dashboard is simple: just click the "Add Widget" button in the top right-hand corner to get started.
Whether you prefer to use pre-built chart types or create custom widgets tailored to your needs, dashboard widgets offer unmatched flexibility. The intuitive edit mode lets you manage and customise your dashboard easily, making sure it aligns perfectly with your workflow.
These capabilities let you build dynamic dashboards that simplify data analysis and drive smarter decisions.
To make finding the right widget even more convenient, widget categories have been introduced. These categories organise the pre-built widgets into specific groups, helping you discover the tools you need quickly. With this structured approach, you save time and get valuable insight from your data straight away.
Widget categories:
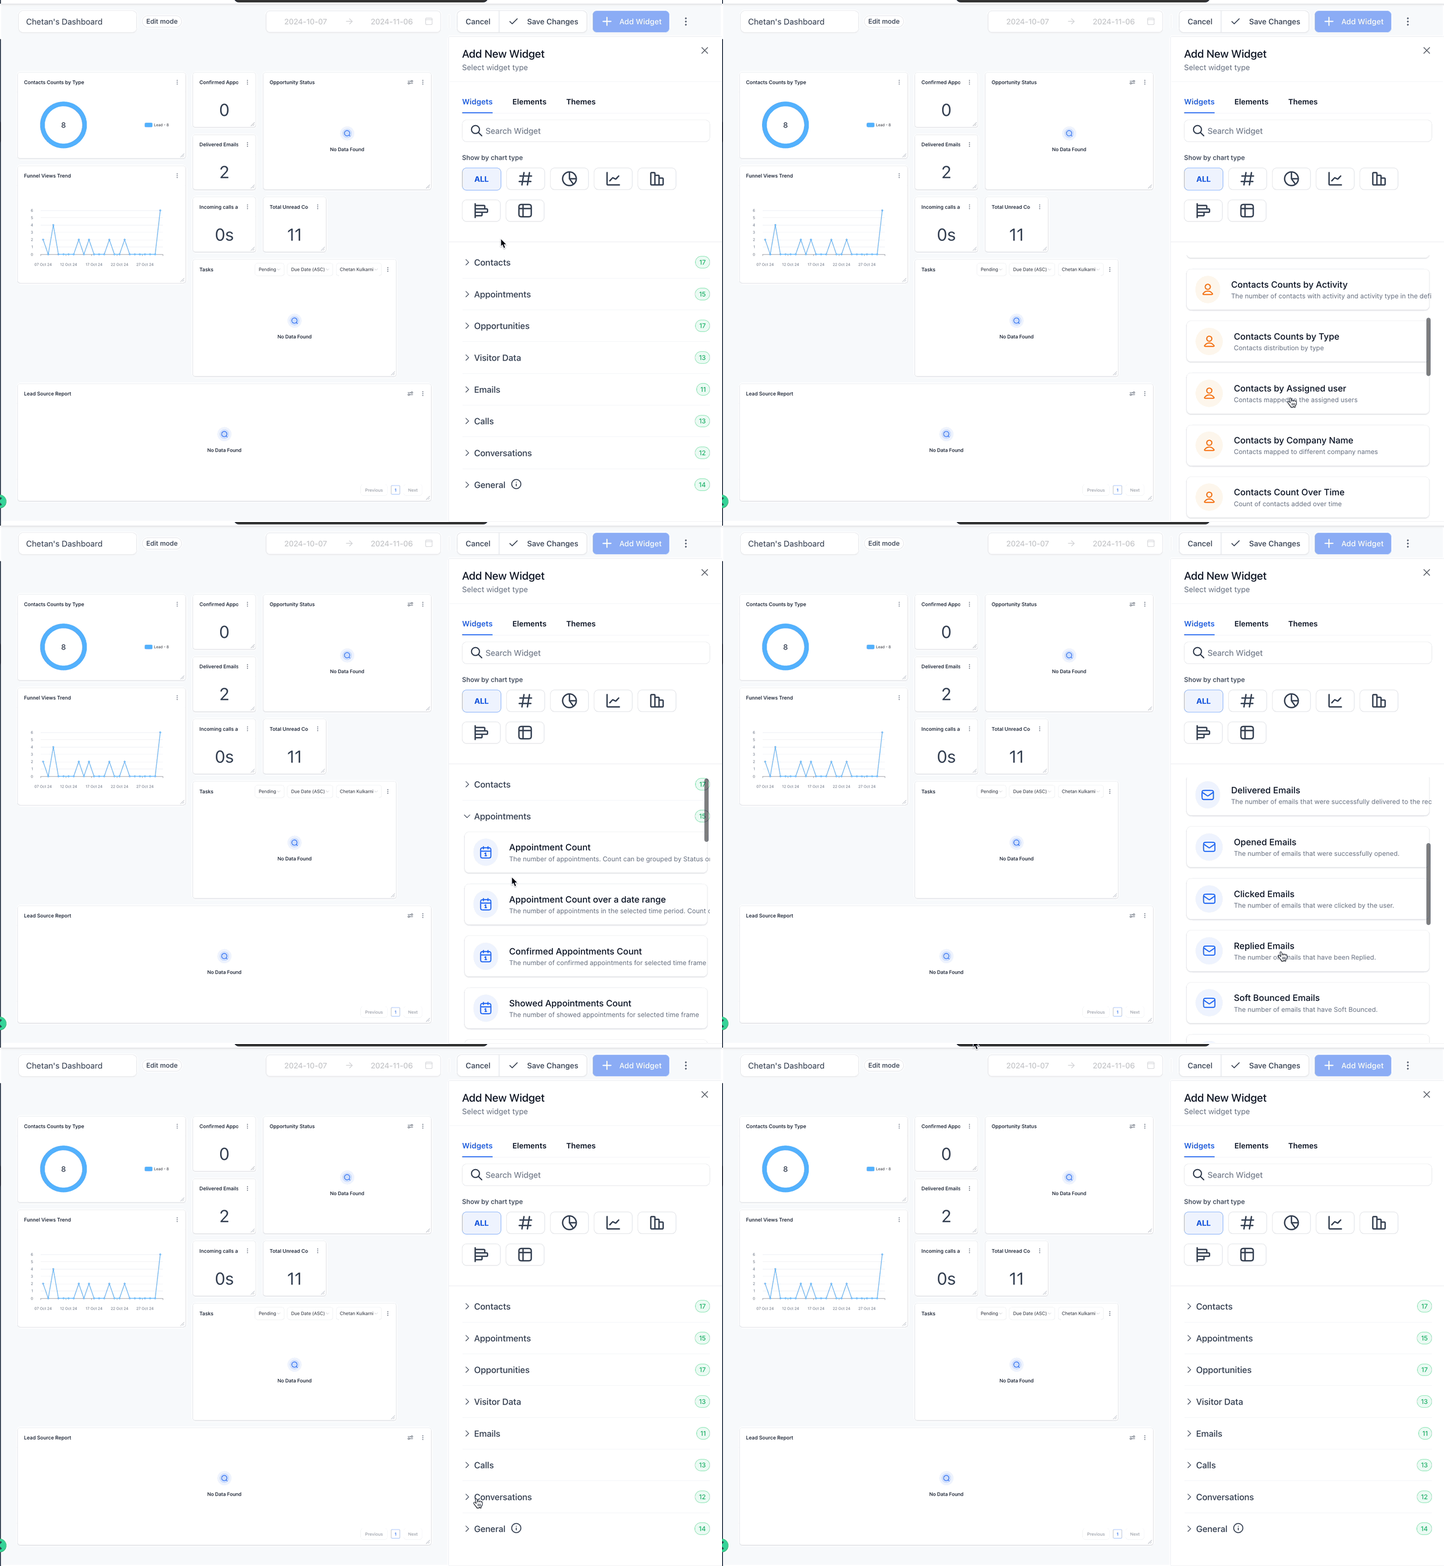
| No. | Widget category | Description |
|---|---|---|
| 1 | Contacts | Helps you manage and analyse new leads efficiently. |
| 2 | Appointments | Helps you track and optimise meetings with your team and your customers. |
| 3 | Opportunities | Provides insight into the status of deals and their monetary value. |
| 4 | Visitor data | Gives an overview of funnel visitor activity and related insights. |
| 5 | Lets users view email campaign activity. | |
| 6 | Calls | Provides detailed insight into call activity. |
| 7 | Conversations | Helps you track conversation data. |
| 8 | General | Offers pre-built data and performance reports for various platforms. |
Filtering opportunity widgets by a specific sales pipeline
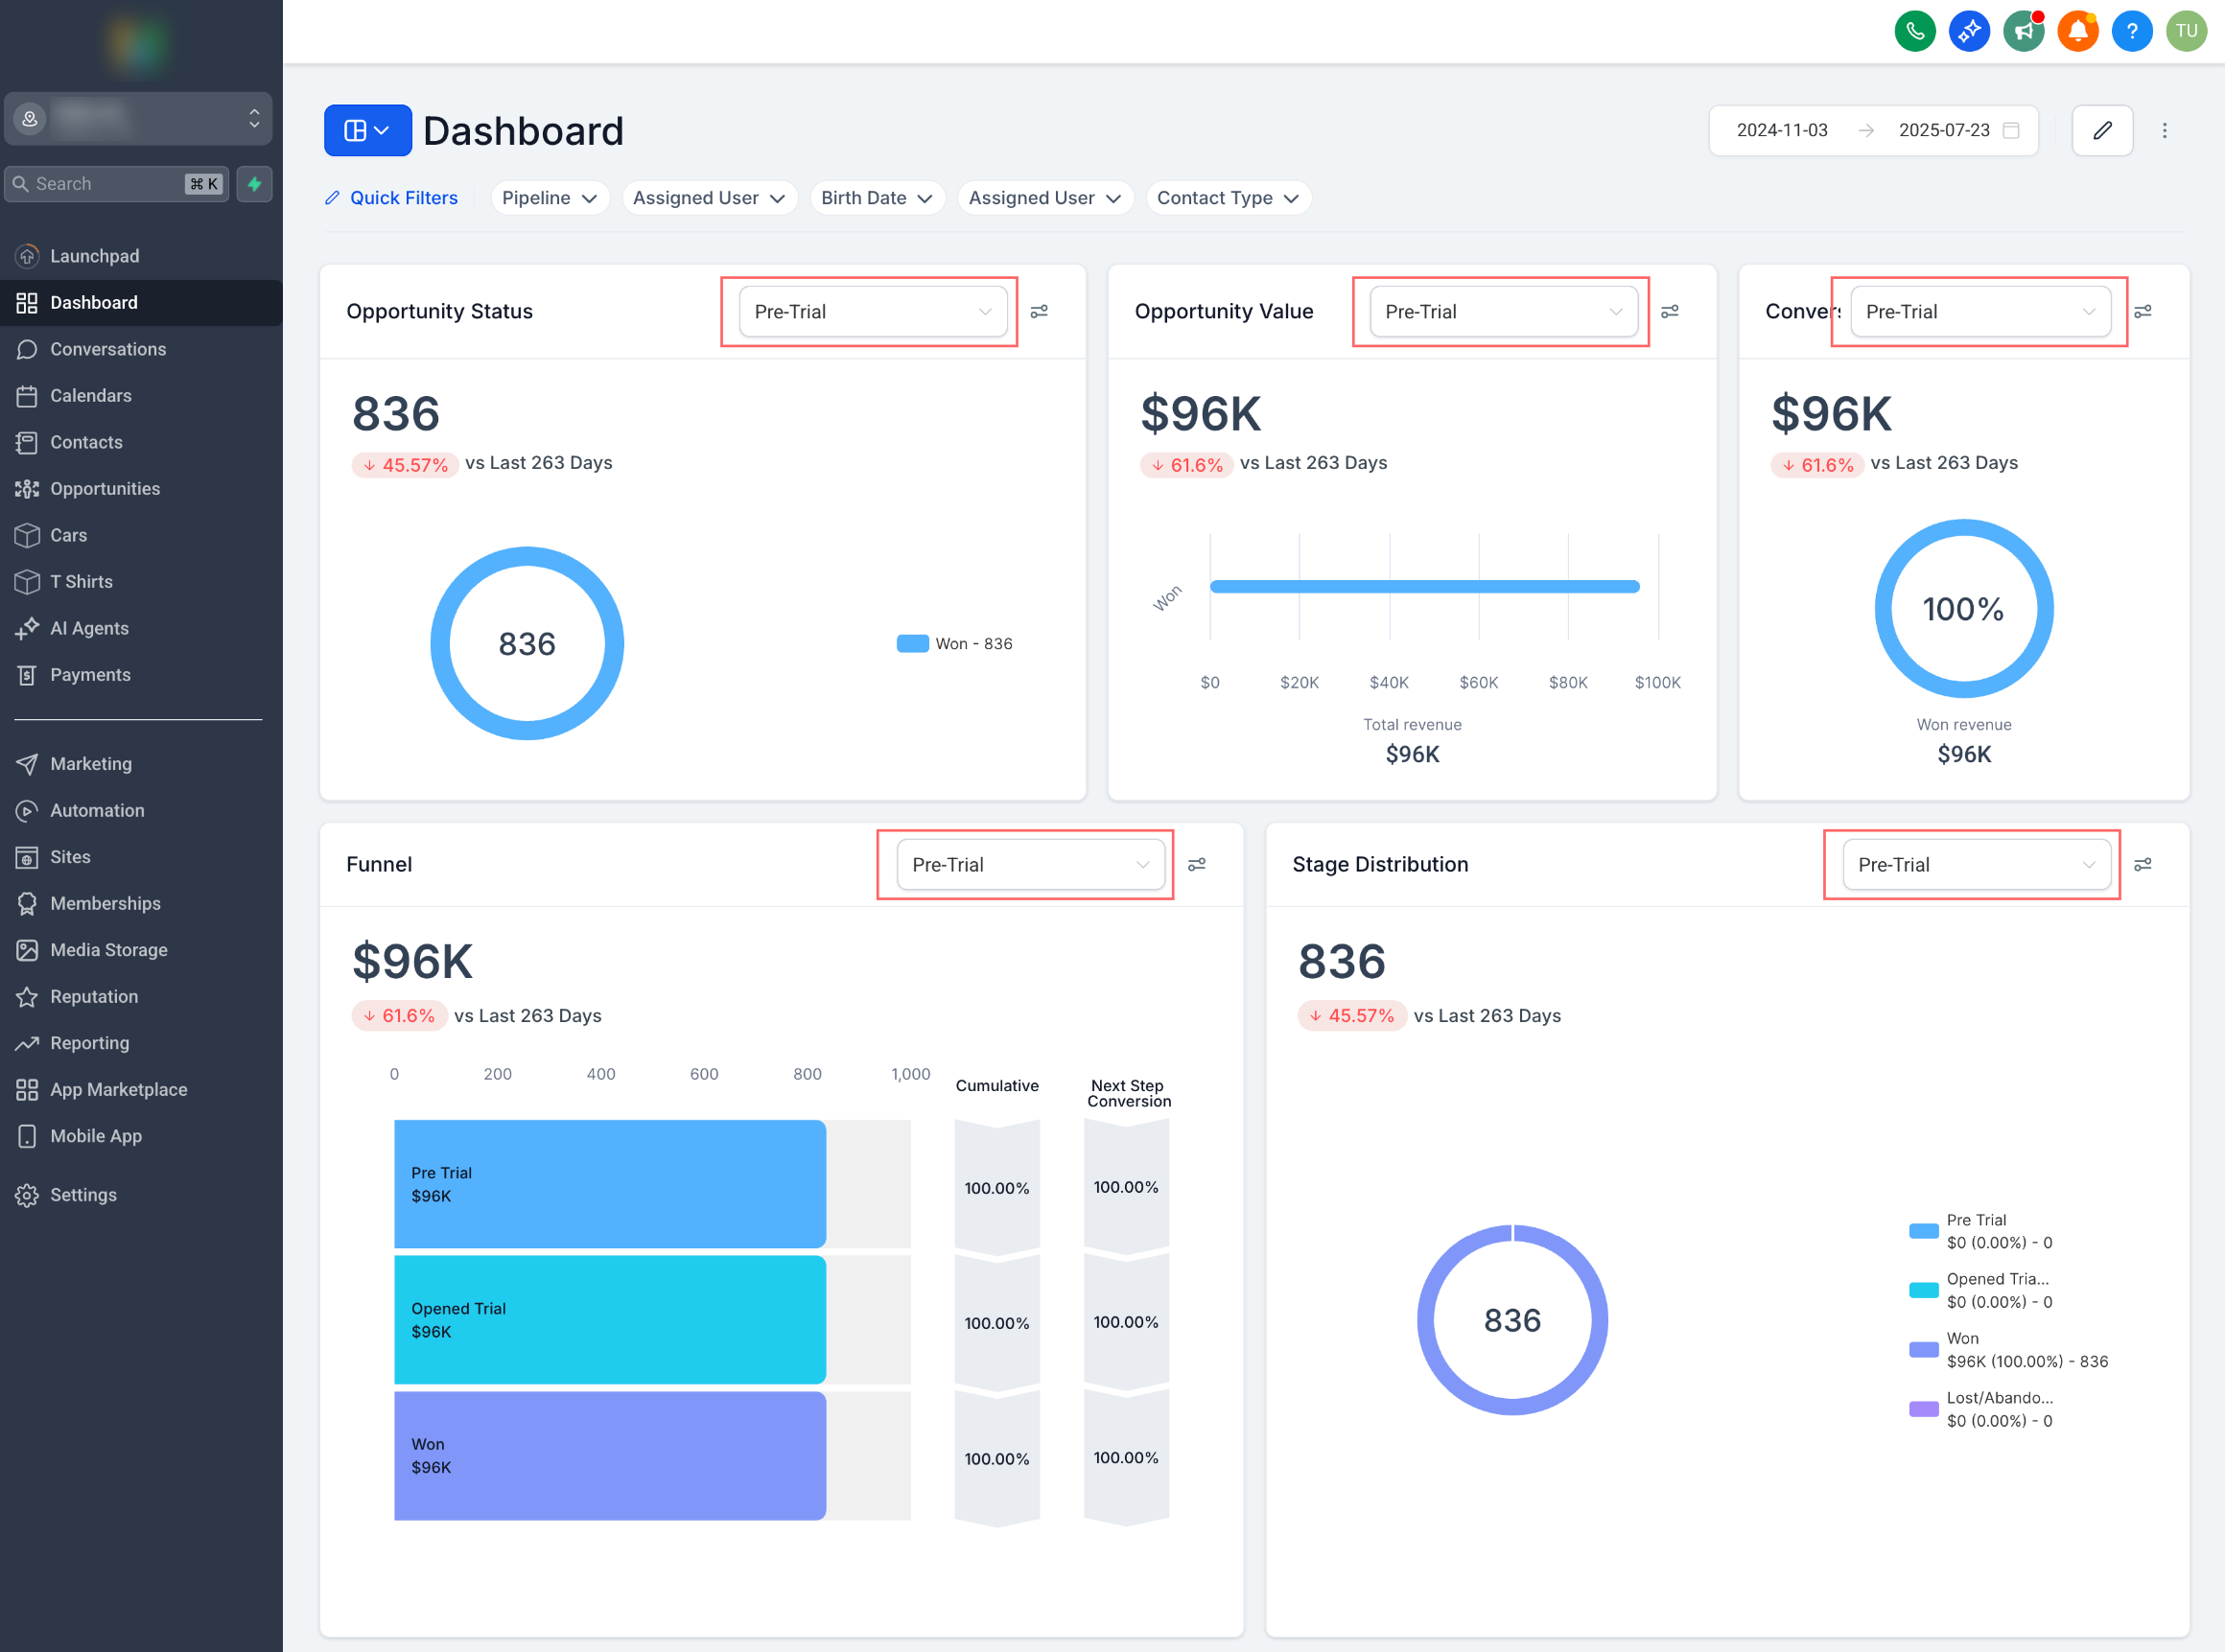
The following general widgets include a Pipeline drop-down inside the widget. Use it to view the metrics for a single sales pipeline instead of the aggregated results across all pipelines:
- Opportunity status
- Opportunity value
- Conversion rate
- Lead source report
- Sales efficiency
Supported chart types:
- Numeric/Count - A numeric chart, also known as a count chart, is a list of numbers arranged in a particular order.
- Doughnut charts - The numeric value shown inside the doughnut chart changes according to the selected metric (for example, average or maximum).
- Line charts - Display information as a series of points connected by lines and are useful for tracking changes over time.
- Bar charts - Use the length of the bars to compare numeric values.
- Horizontal bar charts - A horizontal bar chart uses rectangular bars to present data. They are used to display comparisons between data categories.
- Tables - Provide organised information and precise detail.
Supported metrics:
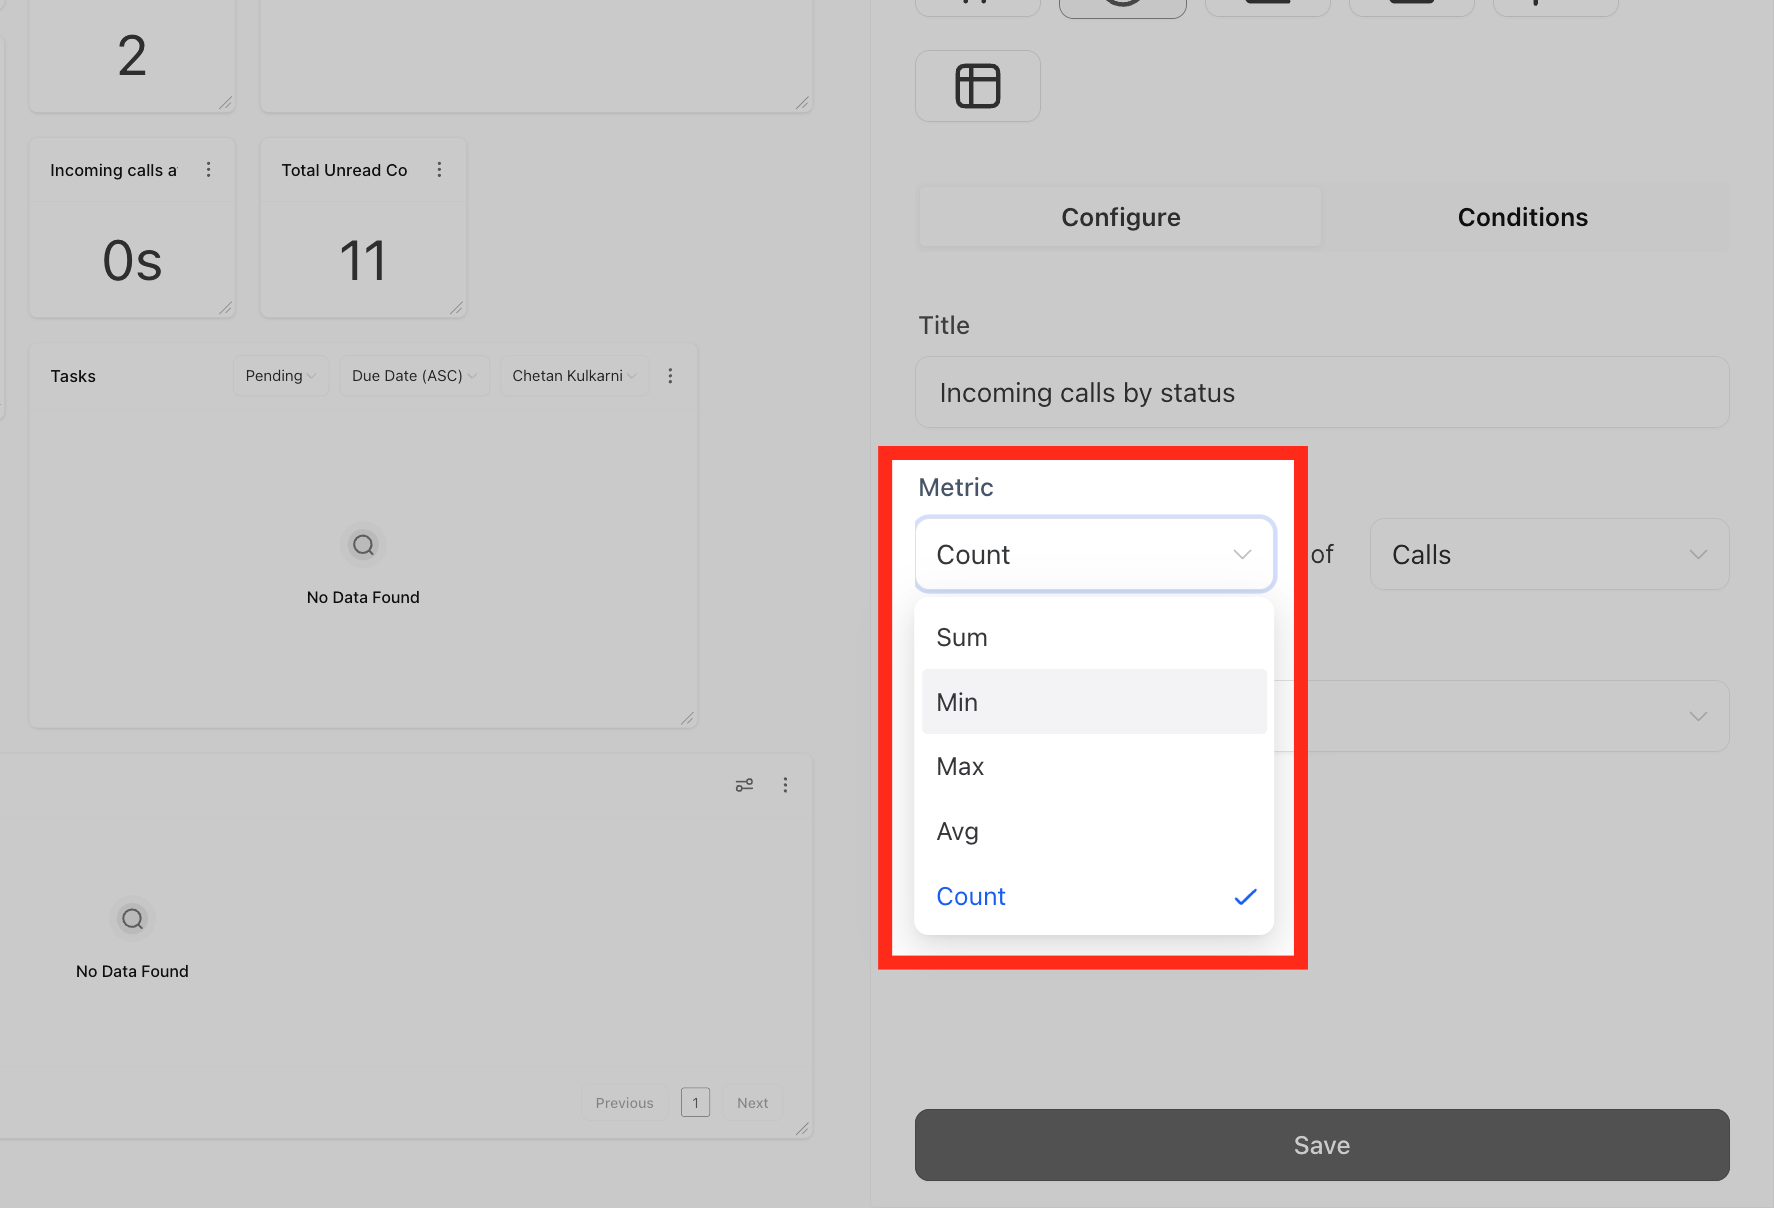
- Sum
- Minimum
- Maximum
- Average
- Count
Using elements in your widgets
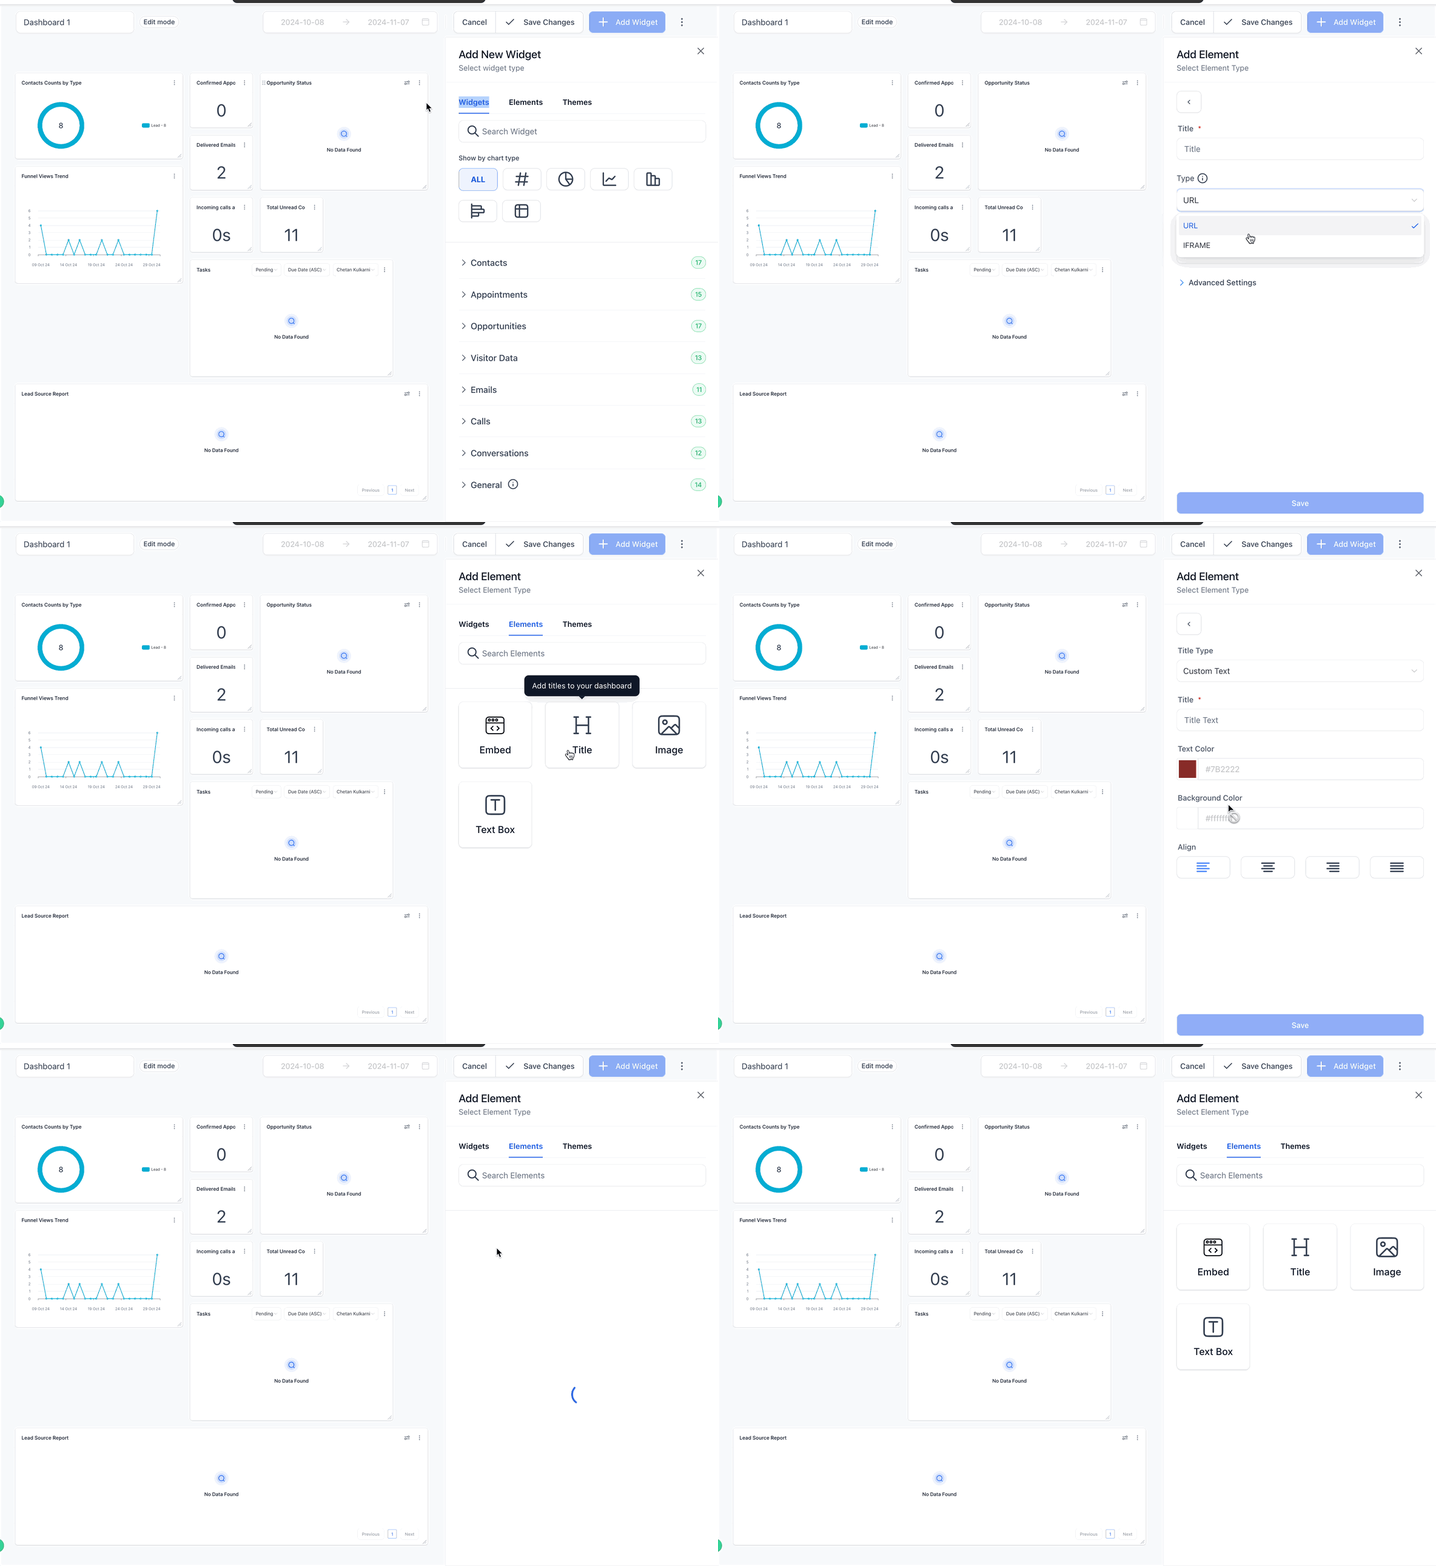
Elements give you the flexibility to customise your dashboard widgets. You can add titles or headings to organise sections and group widgets by theme.
Use text boxes for key information or task reminders to improve team communication. You can also embed images such as logos, charts or infographics to improve the visual impact and provide context.
Using different themes for the dashboard widgets
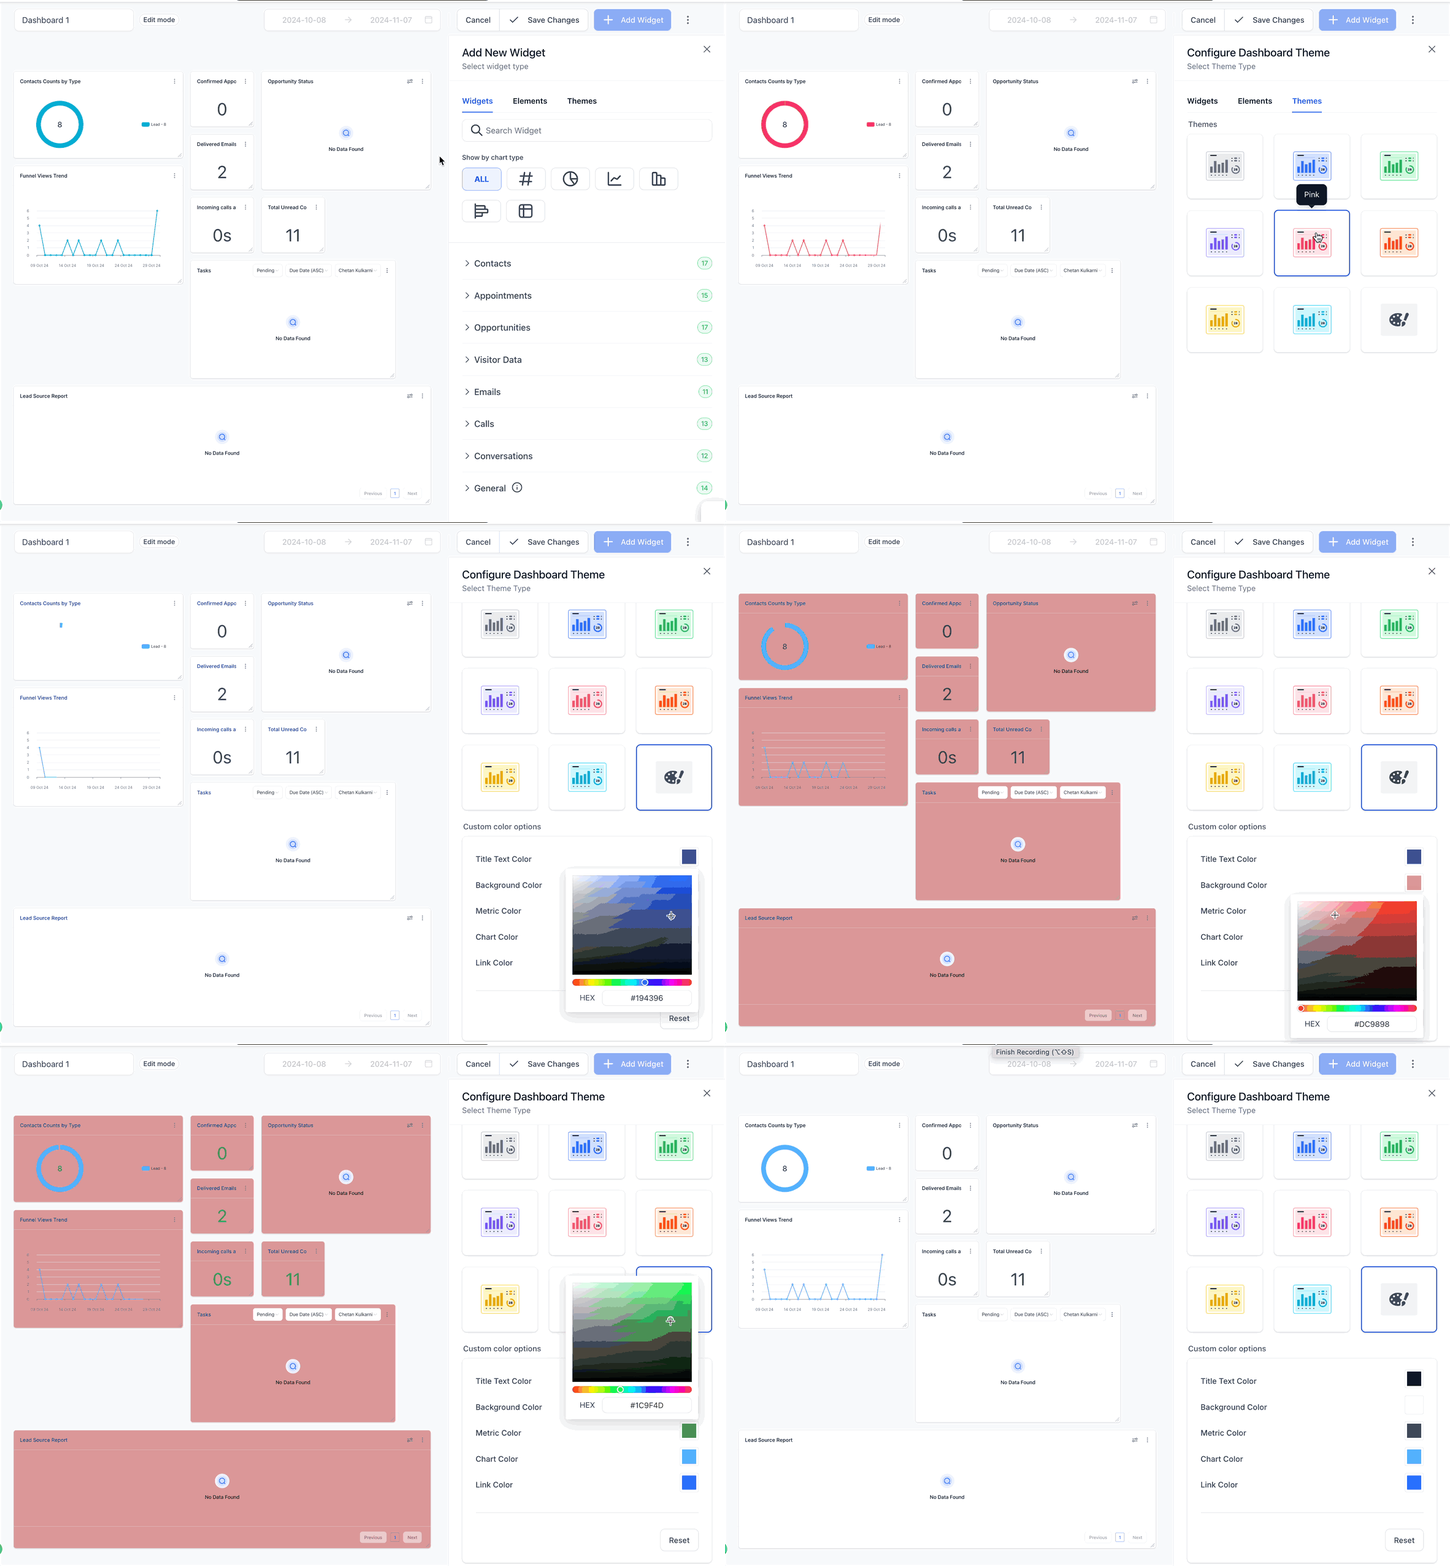
Themes let you customise the look of the entire dashboard or of individual widgets. You can choose from a range of pre-built themes or create your own custom theme with specific colours.
Use cases for the different widgets
Contact widgets:
| No. | Widget | Description |
|---|---|---|
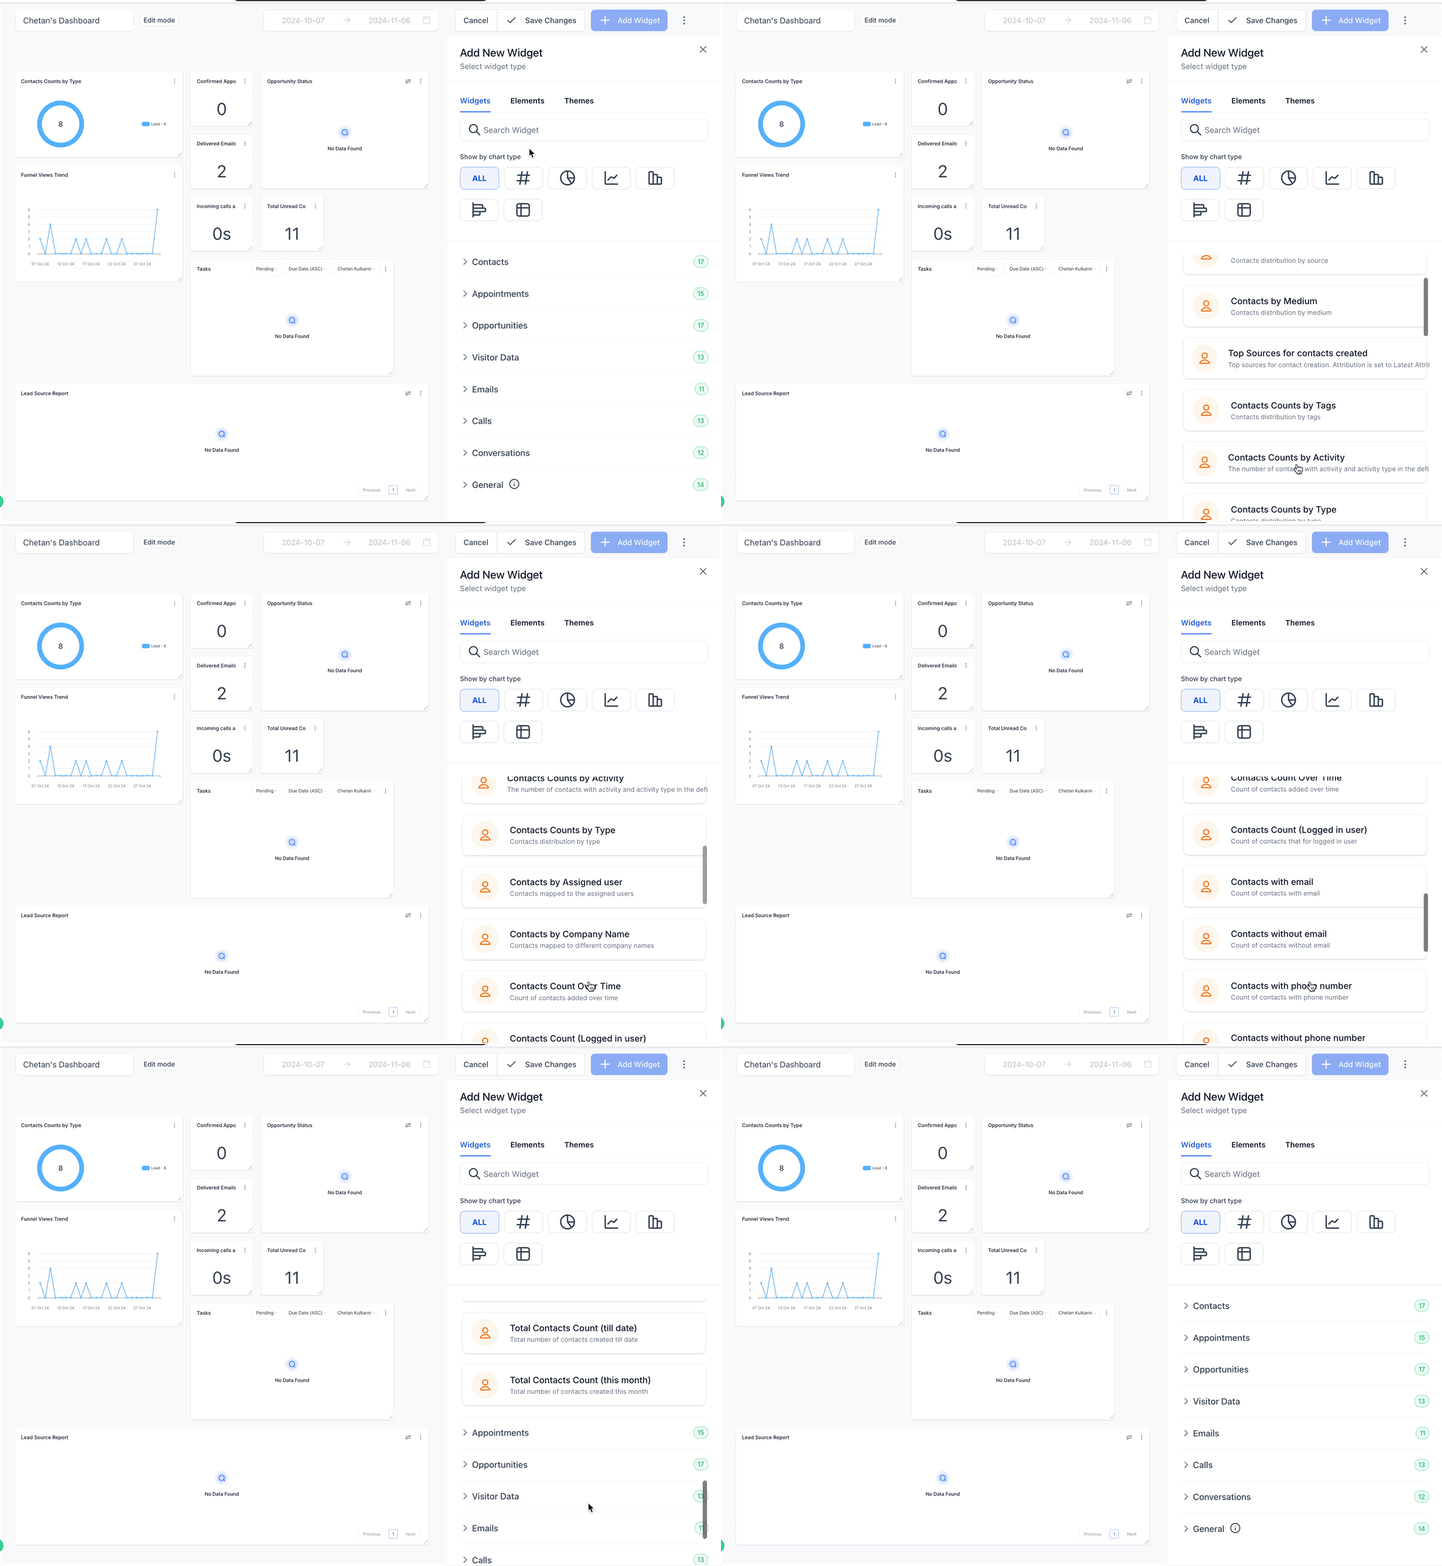
| 1 | Contact count | Quick overview of the total number of contacts. |
| 2 | Contact count (logged-in user) | Shows the contacts assigned to the logged-in user. |
| 3 | Contacts by tag | Shows how contacts are distributed by tag. |
| 4 | Contacts by activity | Monitors contacts with specific activity in a defined time period. |
| 5 | Contacts by type | Displays the distribution of contacts by type. |
| 6 | Contacts by assigned user | Shows how contacts are assigned across team members. |
| 7 | Contacts by company name | Shows the distribution of contacts by company name. |
| 8 | Contacts with email | Tracks the number of contacts with email addresses. |
| 9 | Contacts without email | Tracks the number of contacts without email addresses. |
| 10 | Contacts with phone number | Tracks the number of contacts with phone numbers. |
| 11 | Contacts without phone number | Tracks the number of contacts without phone numbers. |
| 12 | Total contact count (to date) | Point-in-time view of the total contacts created to date. |
| 13 | Total contact count (this month) | Tracks the total contacts created this month. |
| 14 | Contact count (logged-in user) | Counts the contacts associated with the logged-in user. |
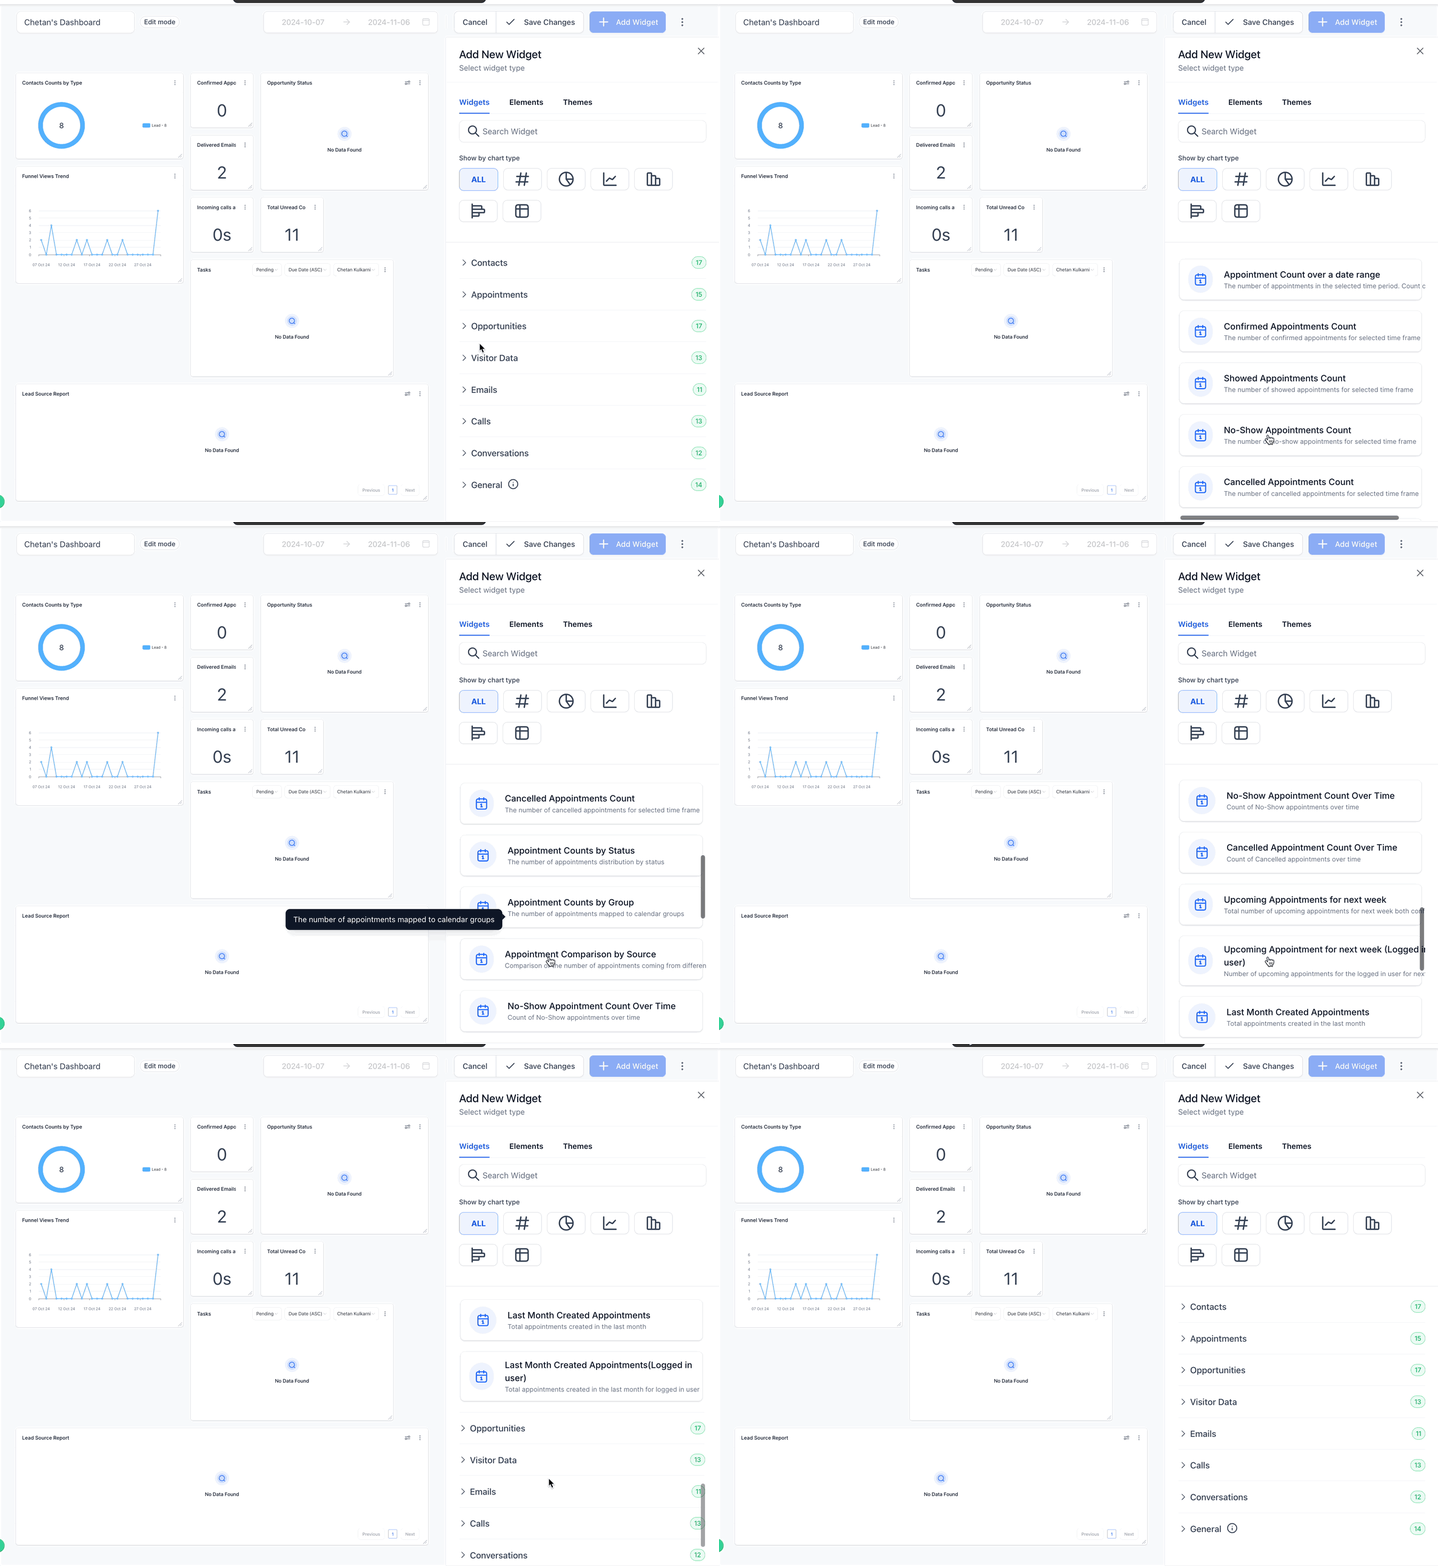
Appointment widgets:
| No. | Widget | Description |
|---|---|---|
| 1 | Appointment count | Tracks total appointments, grouped by status or assignee. |
| 2 | Appointment count by date range | Monitors appointments within a selected time period. |
| 3 | Appointment count by status | Shows the distribution of appointments by status. |
| 4 | Booked appointments | Number of appointments booked within a selected date range. |
| 5 | Confirmed appointments | Number of appointments confirmed within a selected time range. |
| 6 | Attended appointments | Number of appointments where customers turned up. |
| 7 | Missed appointments (no-shows) | Number of appointments marked as missed. |
| 8 | Cancelled appointments | Tracks cancelled and invalid appointments. |
| 9 | No-show rate over time | Shows the trend of no-shows over time. |
| 10 | Upcoming appointments (week) | Total appointments scheduled for the coming week. |
| 11 | Upcoming appointment (logged-in user) | Upcoming appointments for the logged-in user. |
| 12 | Appointments created last month | Total appointments created in the past month. |
| 13 | Appointments created last month (logged-in user) | Last month's appointments created by the logged-in user. |
| 14 | Upcoming appointments (logged-in user) | Upcoming appointments tailored to the logged-in user. |
| 15 | Upcoming appointments for next week | Total appointments for the coming week, including confirmed and unconfirmed bookings. |
| 16 | Appointments created last month | Summary of last month's activity by number of appointments created. |
| 17 | Appointments created last month (logged-in user) | The logged-in user's appointments created in the past month. |
These widgets help you stay organised and make data-driven decisions about your appointments.
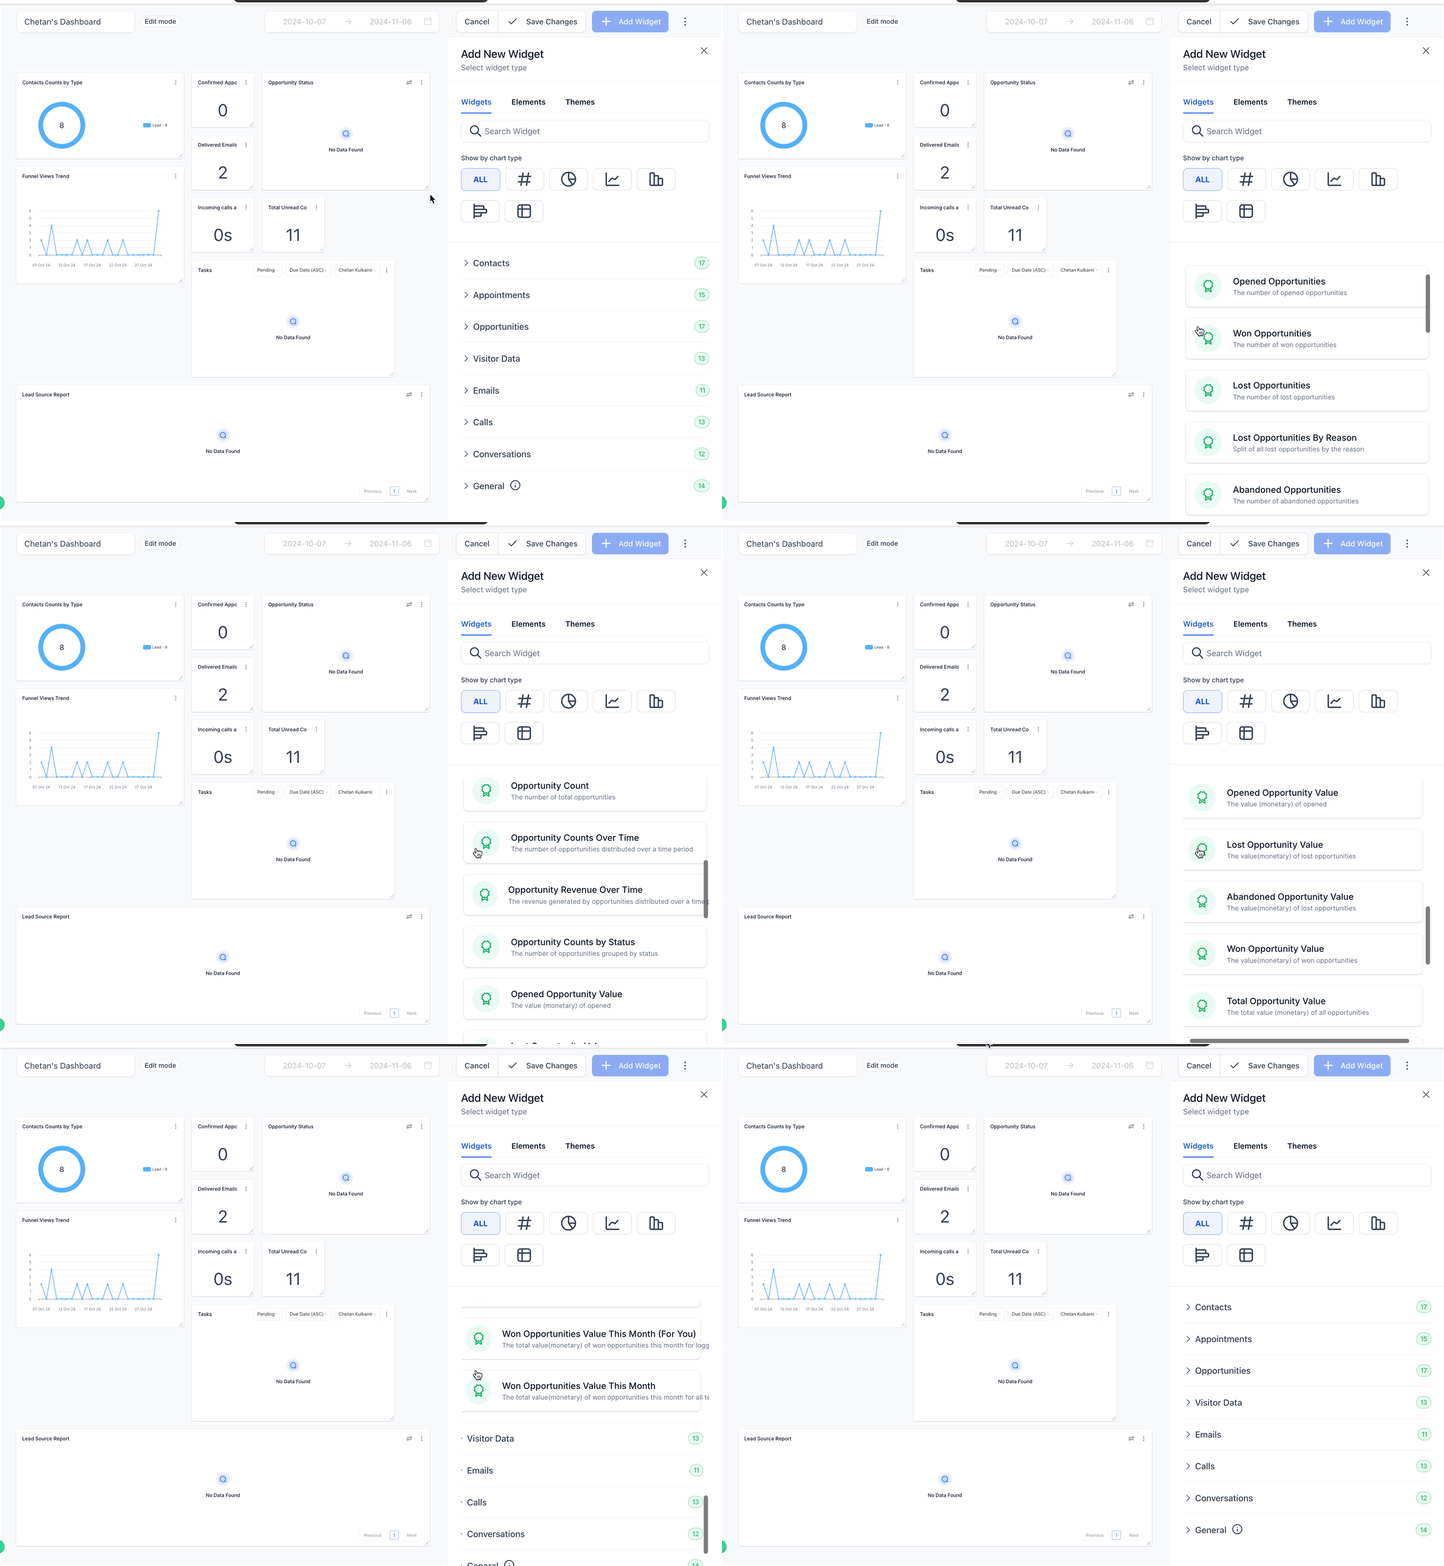
Opportunity widgets:
| No. | Widget | Description |
|---|---|---|
| 1 | Open opportunities | Number of opportunities currently open. |
| 2 | Won opportunities | Opportunities successfully closed as deals. |
| 3 | Lost opportunities | Opportunities that did not convert into deals. |
| 4 | Abandoned opportunities | Opportunities left without action. |
| 5 | Opportunity count | Total overview of opportunities. |
| 6 | Opportunity count over time | Shows the distribution of opportunities over time. |
| 7 | Opportunity revenue over time | Tracks the revenue generated by opportunities over time. |
| 8 | Opportunity count by status | Categorises opportunities by status. |
| 9 | Open opportunity value | Monetary value of the opportunities in progress. |
| 10 | Lost opportunity value | Value of the lost opportunities. |
| 11 | Abandoned opportunity value | Value of the abandoned opportunities. |
| 12 | Won opportunity value | Value of the converted opportunities. |
| 13 | Total opportunity value | Cumulative value of all opportunities. |
| 14 | Lost opportunities by reason | Breakdown of the lost opportunities by reason. |
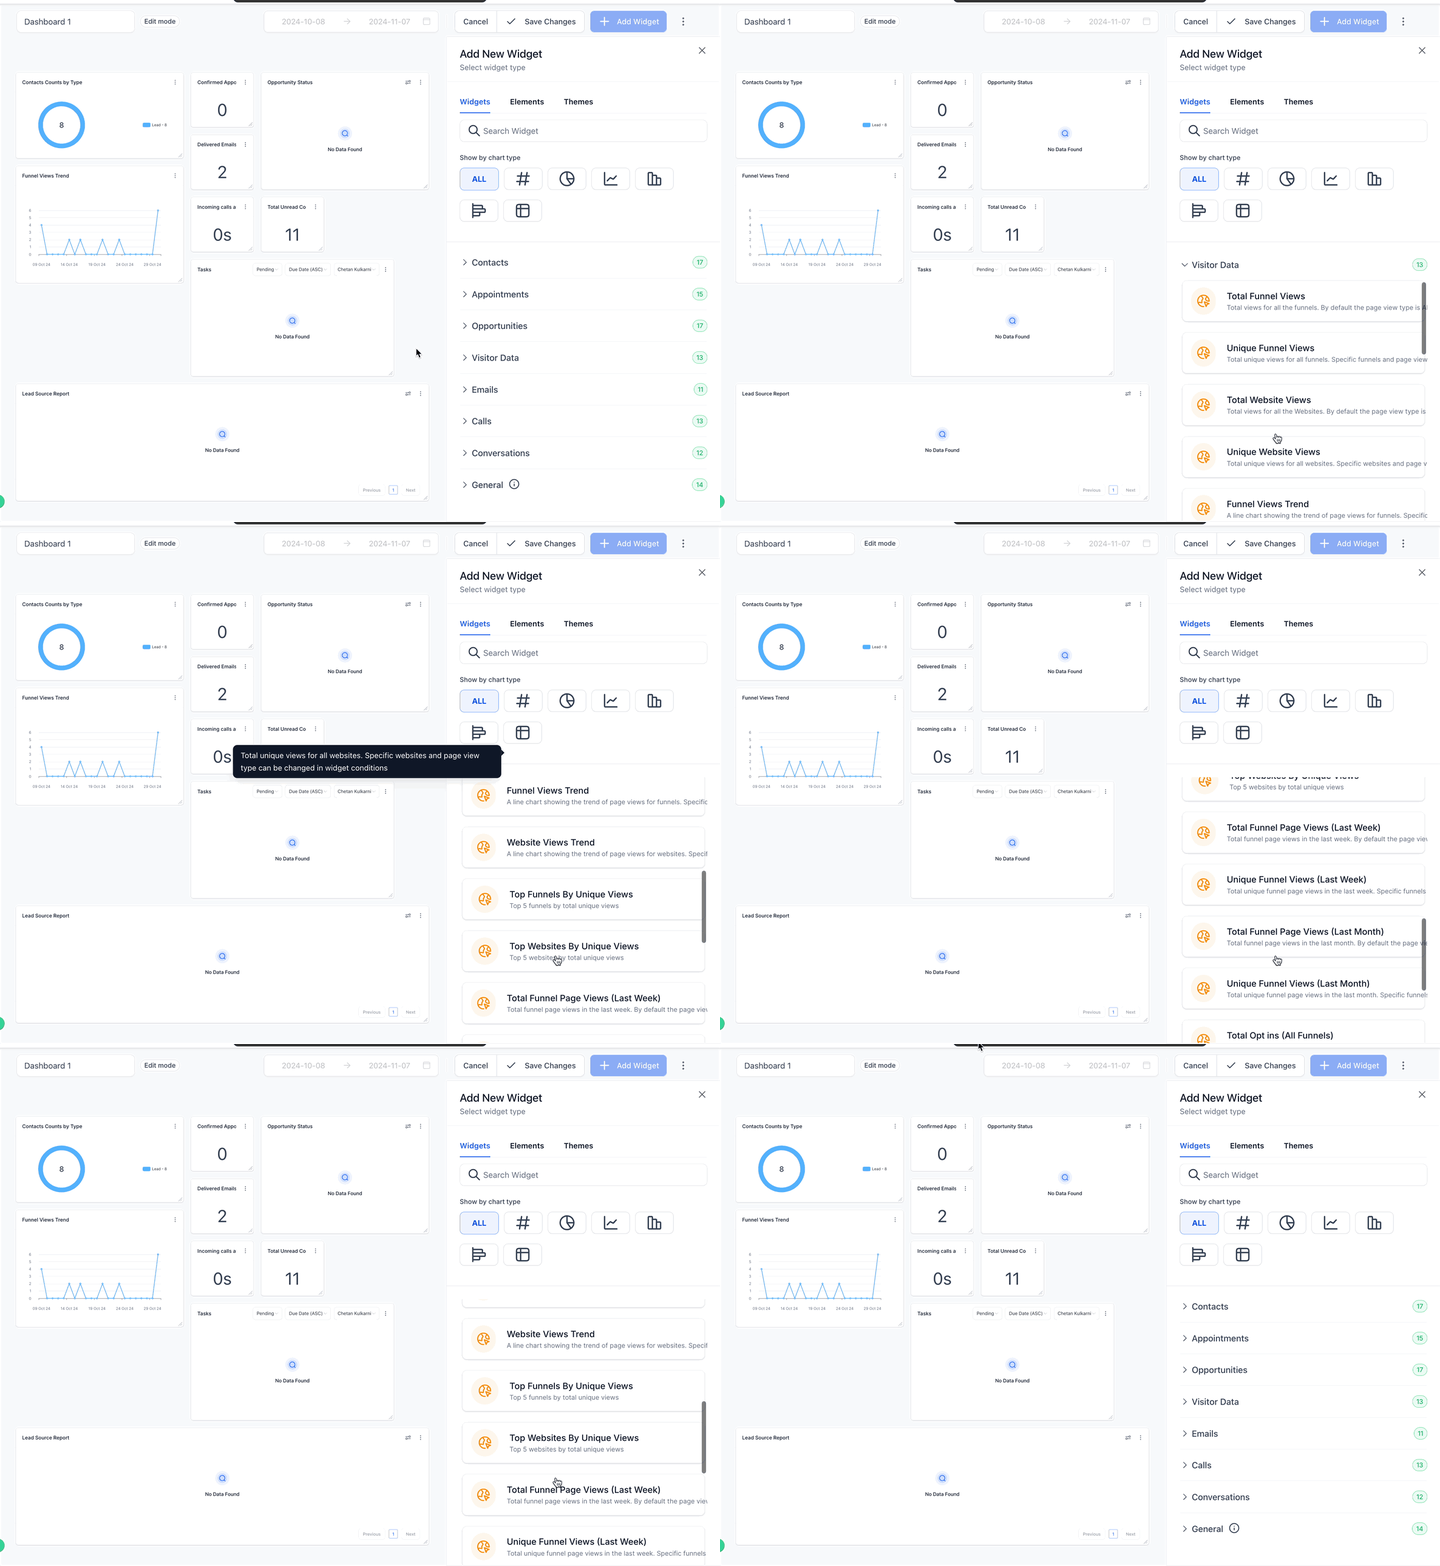
Visitor data widgets (Websites/Funnels):
| No. | Widget | Description |
|---|---|---|
| 1 | Total funnel views | Tracks all funnel views; customisable by funnel and page type. |
| 2 | Unique funnel views | Counts unique funnel visitors. |
| 3 | Total website views | Tracks total views across all websites. |
| 4 | Unique website views | Shows unique website visitors. |
| 5 | Funnel view trend | Line chart for funnel views over time. |
| 6 | Website view trend | Line chart for website views over time. |
| 7 | Top funnels by unique views | The top 5 funnels by unique views. |
| 8 | Top websites by unique views | The top 5 websites by unique visitors. |
| 9 | Total funnel page views (last week) | Funnel views over the last week. |
| 10 | Unique funnel views (last week) | Unique funnel visitors over the last week. |
| 11 | Total funnel page views (last month) | Funnel views over the last month. |
| 12 | Unique funnel views (last month) | Unique funnel visitors over the last month. |
| 13 | Total opt-ins (all funnels) | Total opt-ins across all funnels. |
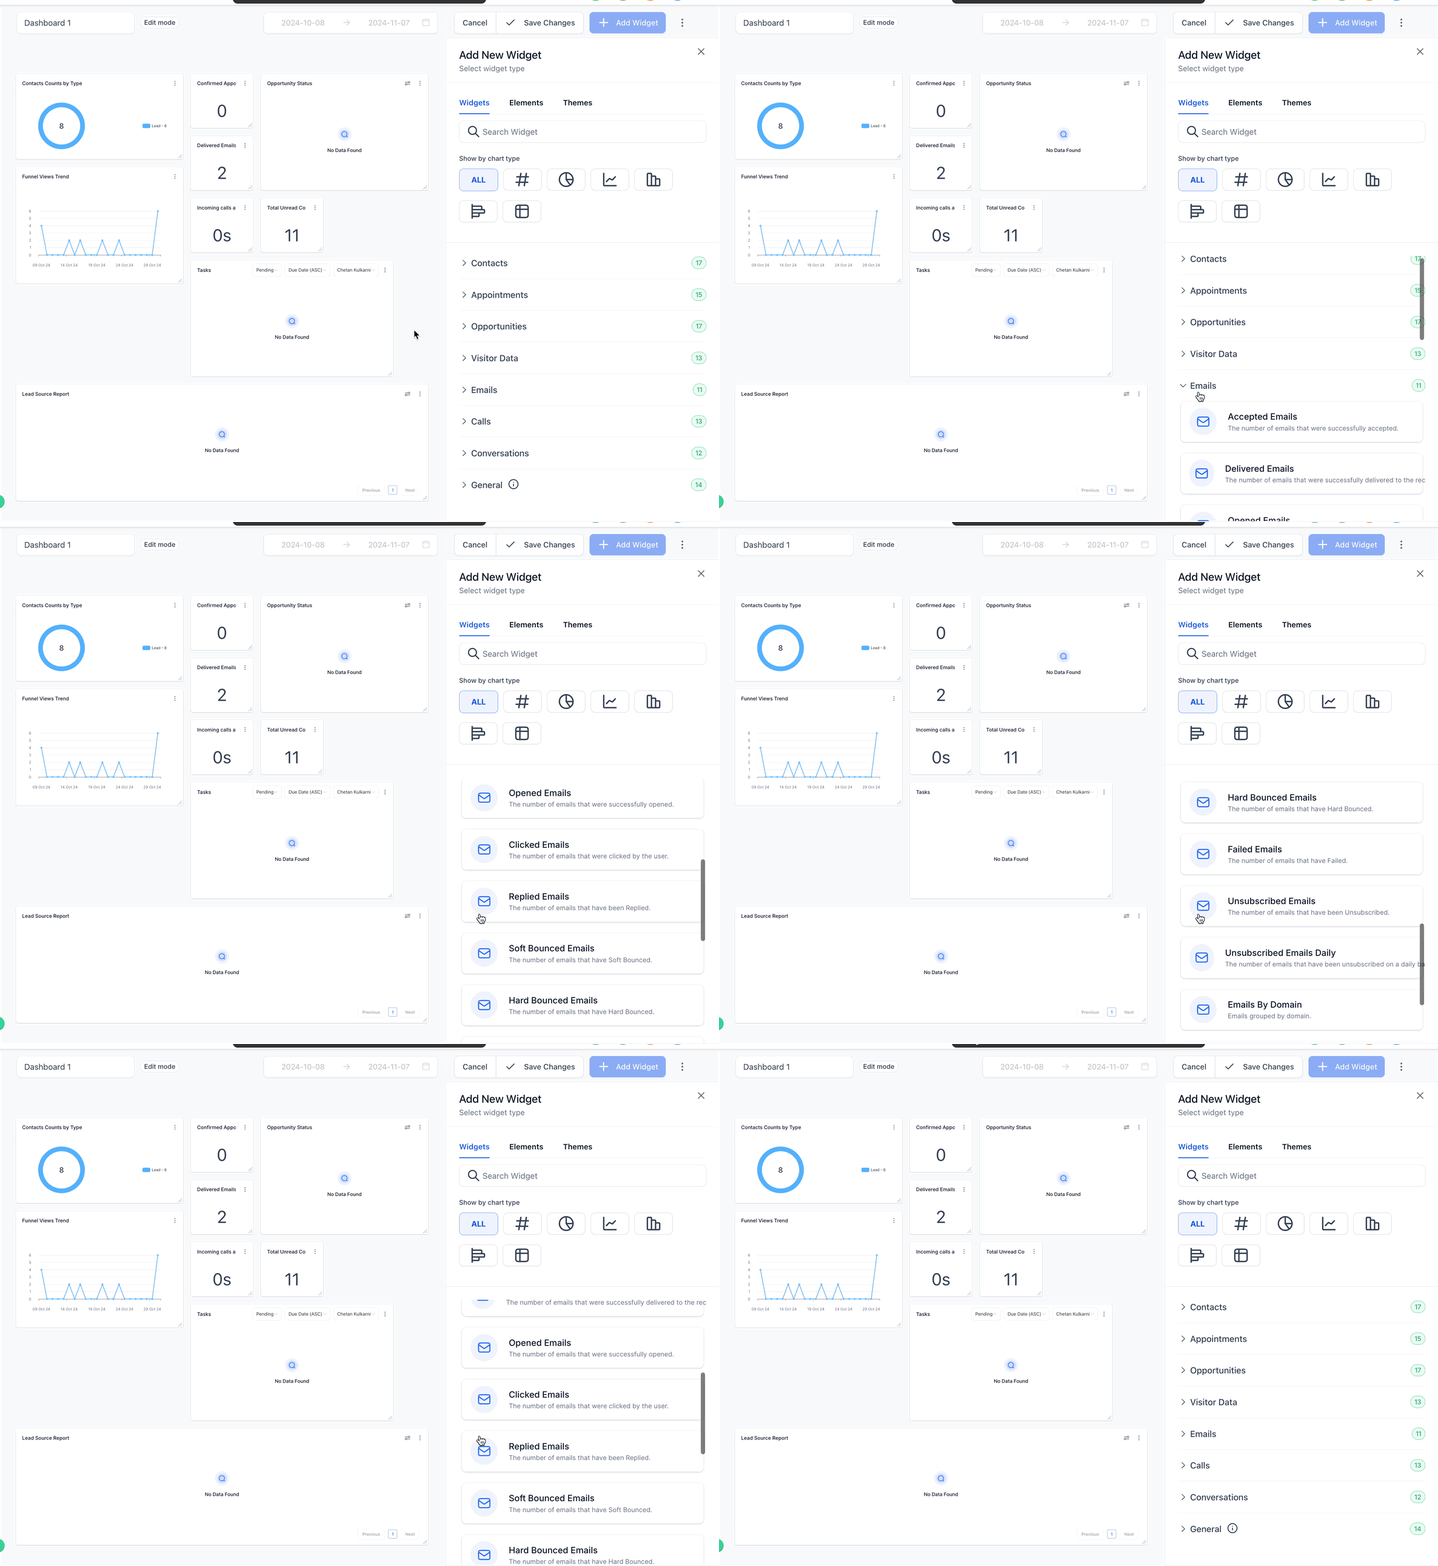
Email widgets:
| No. | Widget | Description |
|---|---|---|
| 1 | Accepted emails | Number of emails accepted successfully. |
| 2 | Delivered emails | Number of emails delivered to recipients. |
| 3 | Opened emails | Number of emails opened by recipients. |
| 4 | Clicked emails | Number of emails in which links were clicked. |
| 5 | Replied emails | Number of emails that received a reply. |
| 6 | Soft-bounced emails | Number of emails that soft bounced. |
| 7 | Hard-bounced emails | Number of emails that hard bounced. |
| 8 | Failed emails | Number of failed email deliveries. |
| 9 | Unsubscribed emails | Number of recipients who unsubscribed. |
| 10 | Daily unsubscribed emails | Daily count of unsubscribed emails. |
| 11 | Emails by domain | Emails grouped by recipient domain. |
Reading the fields in the email widget table

If you use a table chart for the email widgets, the "Source Action Name" column helps you trace where the email activity originated.

For emails linked to an automation, the "Source Action Name" shows the name of the automation step, making it easier to connect email records to the automation run.
Call widgets:
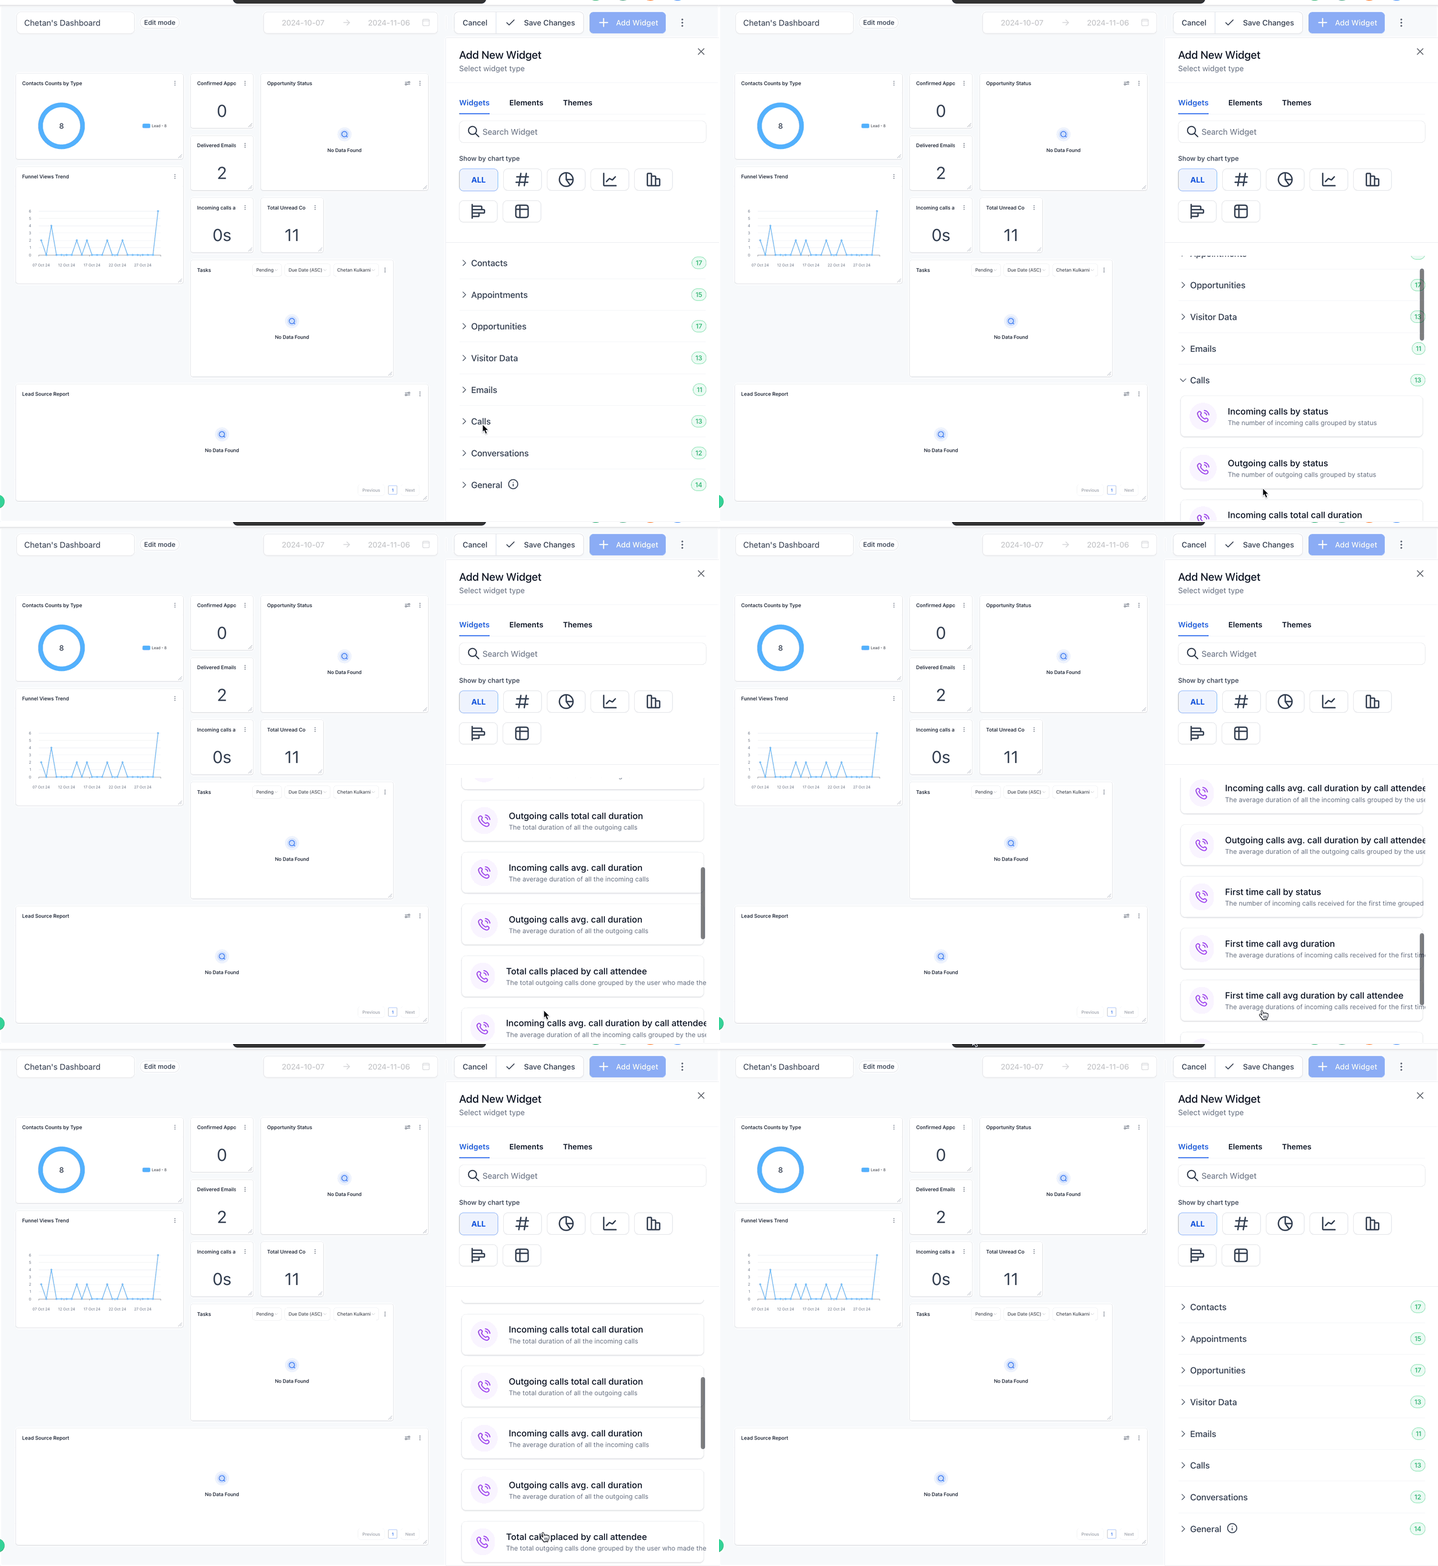
| No. | Widget | Description |
|---|---|---|
| 1 | Inbound calls by status | Grouped count of inbound calls by status. |
| 2 | Outbound calls by status | Grouped count of outbound calls by status. |
| 3 | Total inbound call duration | Total duration of all inbound calls. |
| 4 | Total outbound call duration | Total duration of all outbound calls. |
| 5 | Average inbound call duration | Average duration of inbound calls. |
| 6 | Average outbound call duration | Average duration of outbound calls. |
| 7 | Total calls made by participant | Total outbound calls grouped by the user who made the call. |
| 8 | Average inbound call duration by participant | Average duration of inbound calls per participating user. |
| 9 | Average outbound call duration by participant | Average duration of outbound calls per calling user. |
| 10 | First call by status | Count of first inbound calls, grouped by status. |
| 11 | Average first call duration | Average duration of first inbound calls. |
| 12 | Average first call duration by participant | Average duration of first inbound calls per participating user. |
| 13 | Total first call duration | Total duration of first inbound calls. |
Note: the term 'call participant' refers to the team member who took part in the call, either by making it or by receiving it from the customer.
Conversation widgets:
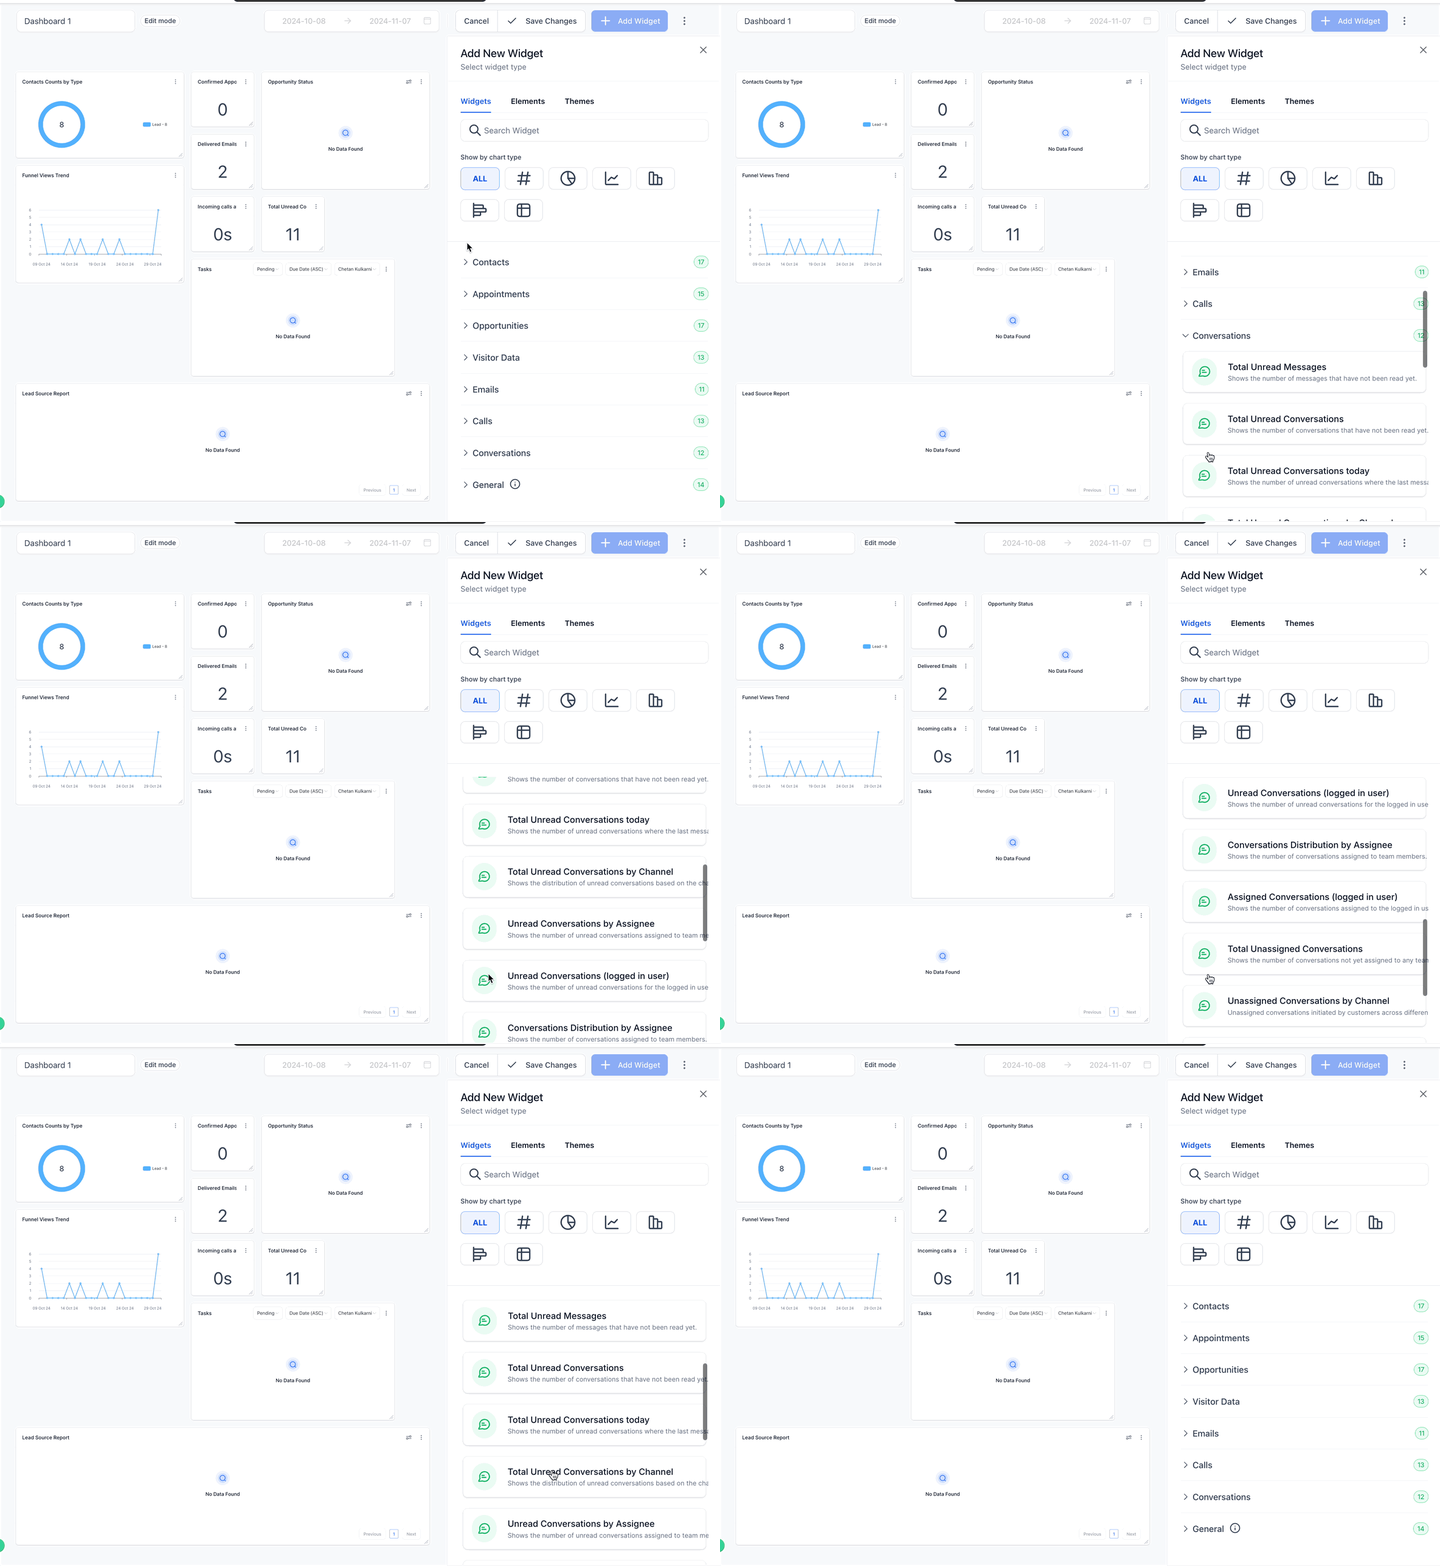
| No. | Widget | Description |
|---|---|---|
| 1 | Total unread conversations | Number of unread conversations. |
| 2 | Total unread conversations today | Unread conversations whose last message was received today. |
| 3 | Total unread conversations by channel | Distribution of unread conversations by the channel of the customer's last message. |
| 4 | Unread conversations by assignee | Number of unread conversations assigned to team members. |
| 5 | Unread conversations (logged-in user) | Number of unread conversations for the logged-in user. |
| 6 | Conversation distribution by assignee | Number of conversations assigned to team members. |
| 7 | Assigned conversations (logged-in user) | Number of conversations assigned to the logged-in user. |
| 8 | Total unassigned conversations | Number of conversations not assigned to any team member. |
| 9 | Unassigned conversations by channel | Unassigned conversations started on different channels. |
| 10 | New conversations started (this week) | Number of conversations started this week. |
Payment widgets:
Revenue and trends
- Total revenue (last month) – Total revenue generated in the last month
- Total revenue trend – Monthly trend of total revenue
- One-off revenue trend – Monthly trend of one-off payments
- Recurring revenue trend – Monthly trend of recurring payments
Customers and payment performance
- Paying customer trend – Monthly trend of paying customers
- Successful payment trend – Monthly trend of payments that went through
- Failed payment trend – Monthly trend of failed payments
Revenue breakdown
- Revenue by channel – Breakdown of revenue across the different payment channels
- Subscription creation trend – Monthly trend of new subscriptions
- Subscription cancellation trend – Monthly trend of cancelled subscriptions
Discounts and invoices
- Coupon usage trend – Monthly trend of coupon usage
- Coupon discount amount trend – Monthly trend of the discount amounts applied
- Invoices sent trend – Monthly trend of invoices sent
- Invoices paid trend – Monthly trend of invoices paid
Refund analysis
- Refund trend – Monthly trend of refunds issued
- Refund amount trend – Monthly trend of total refund amounts
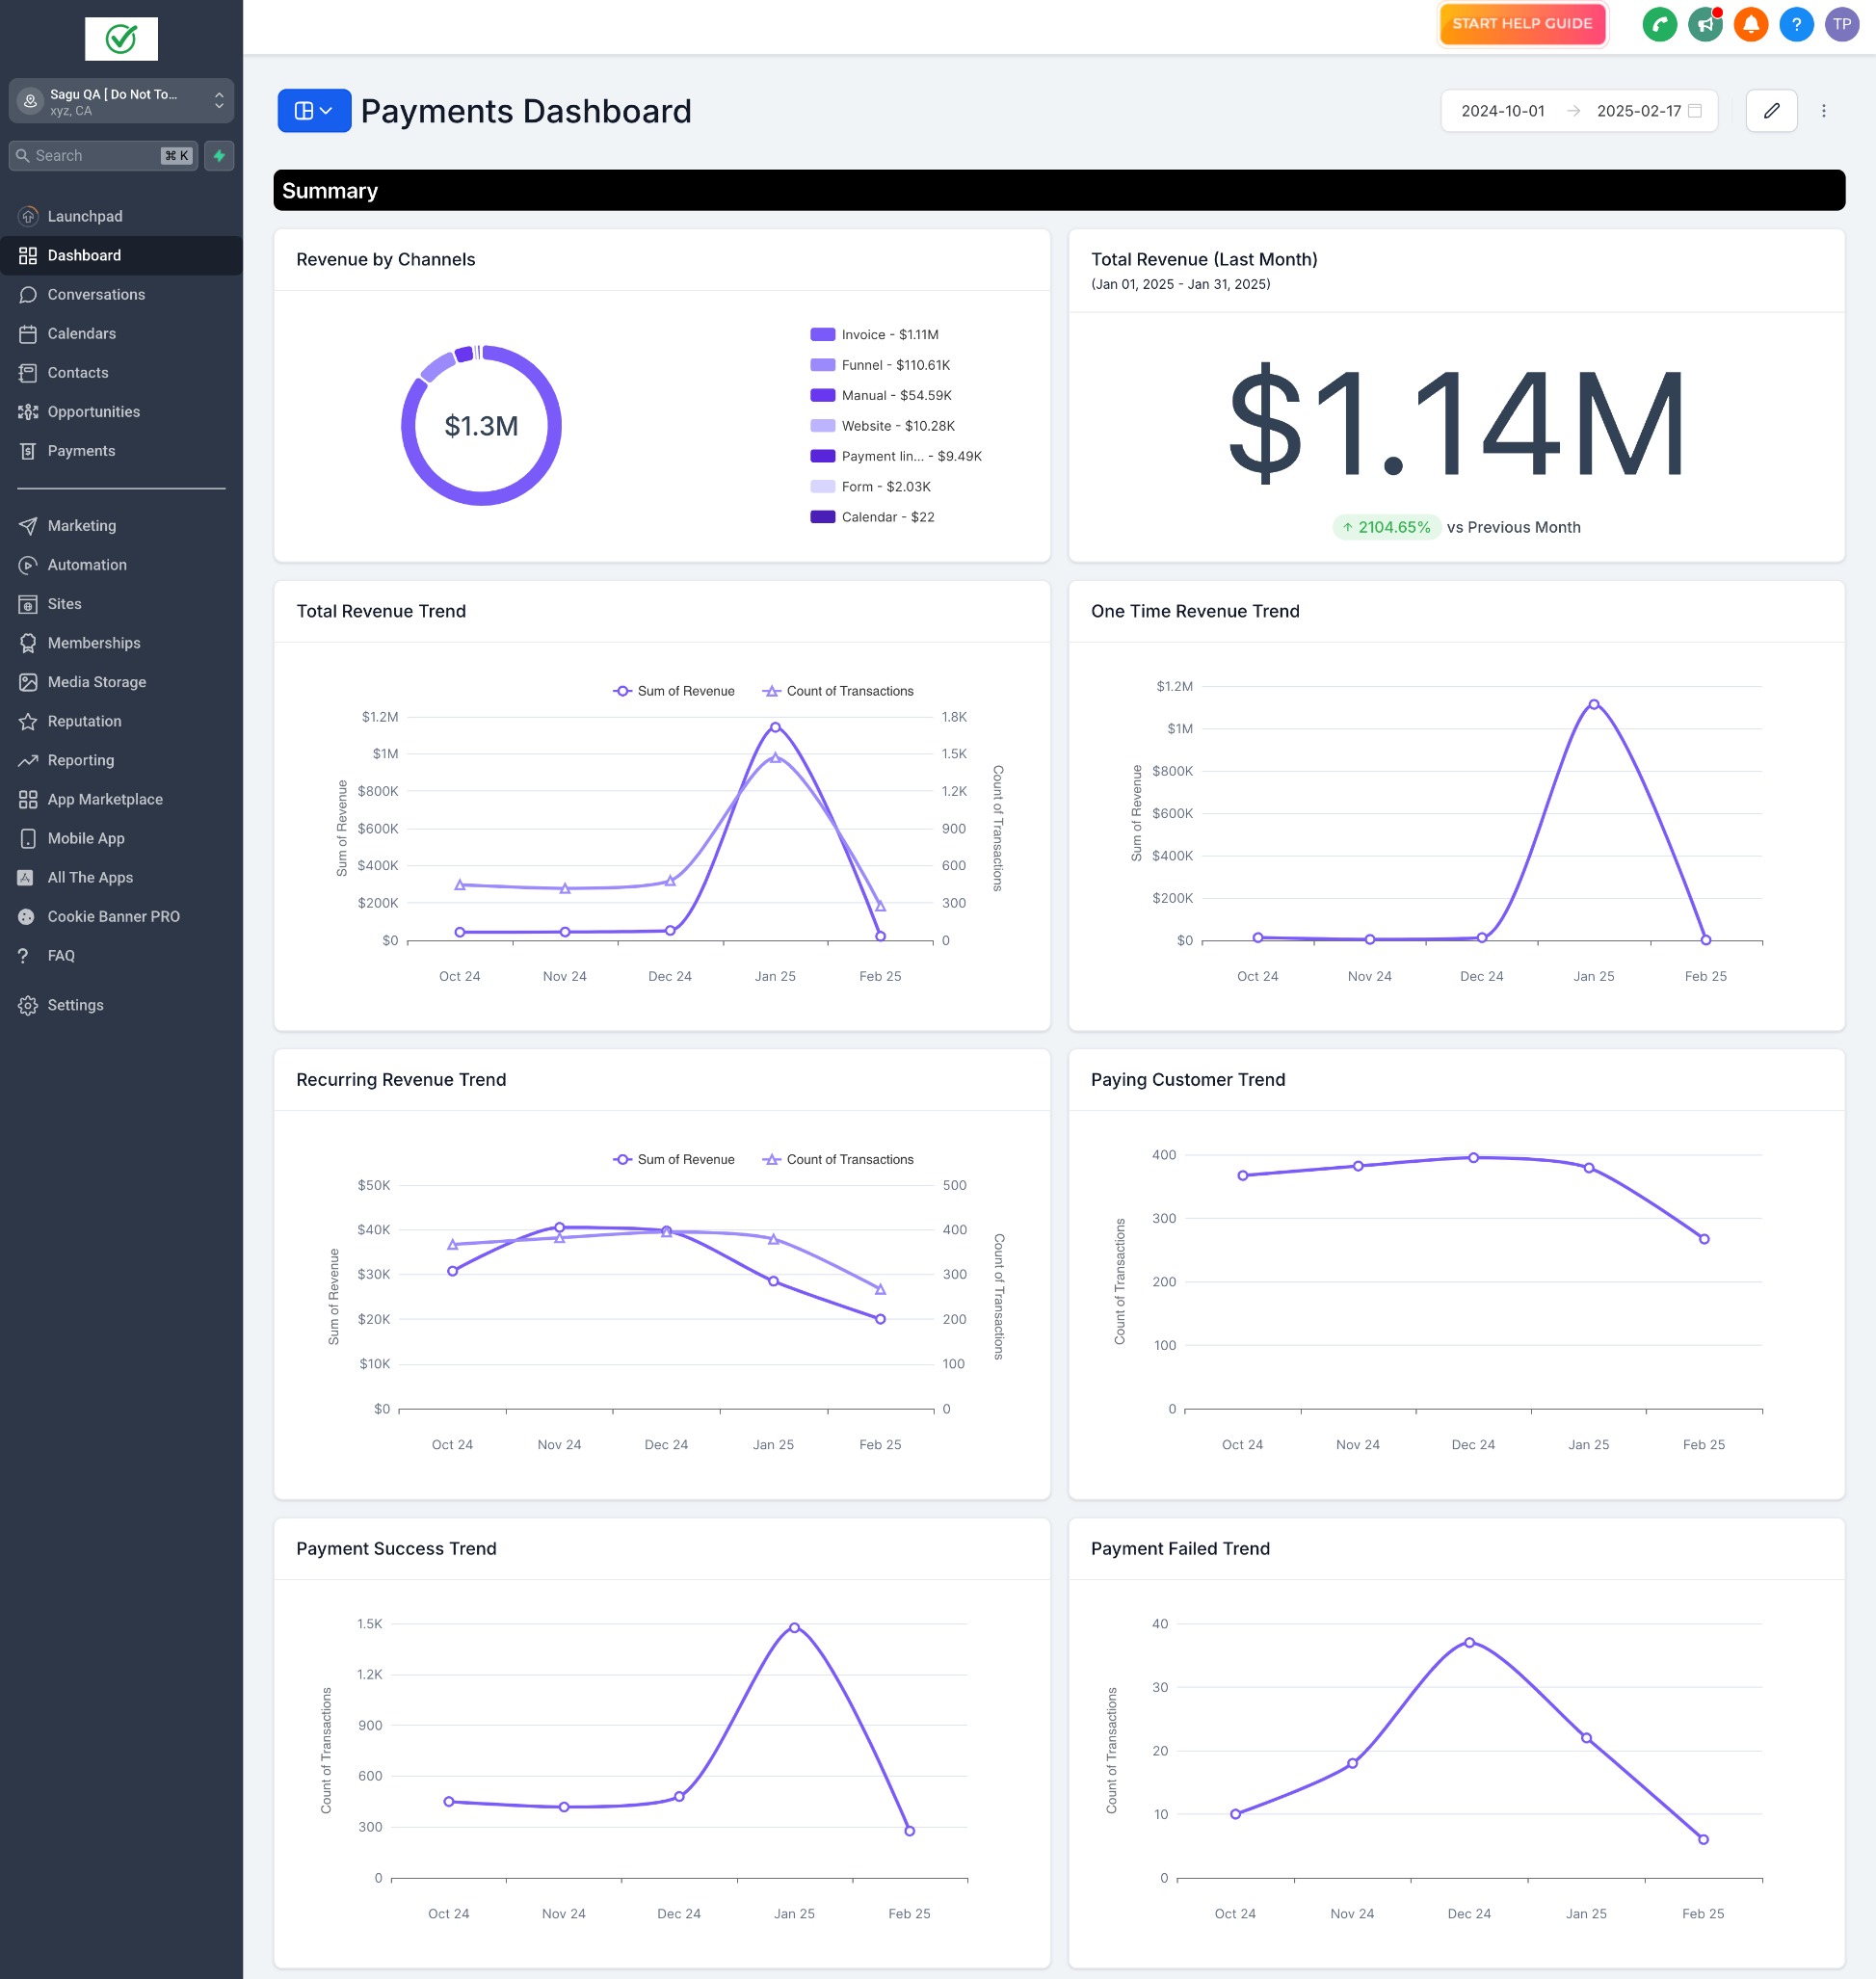
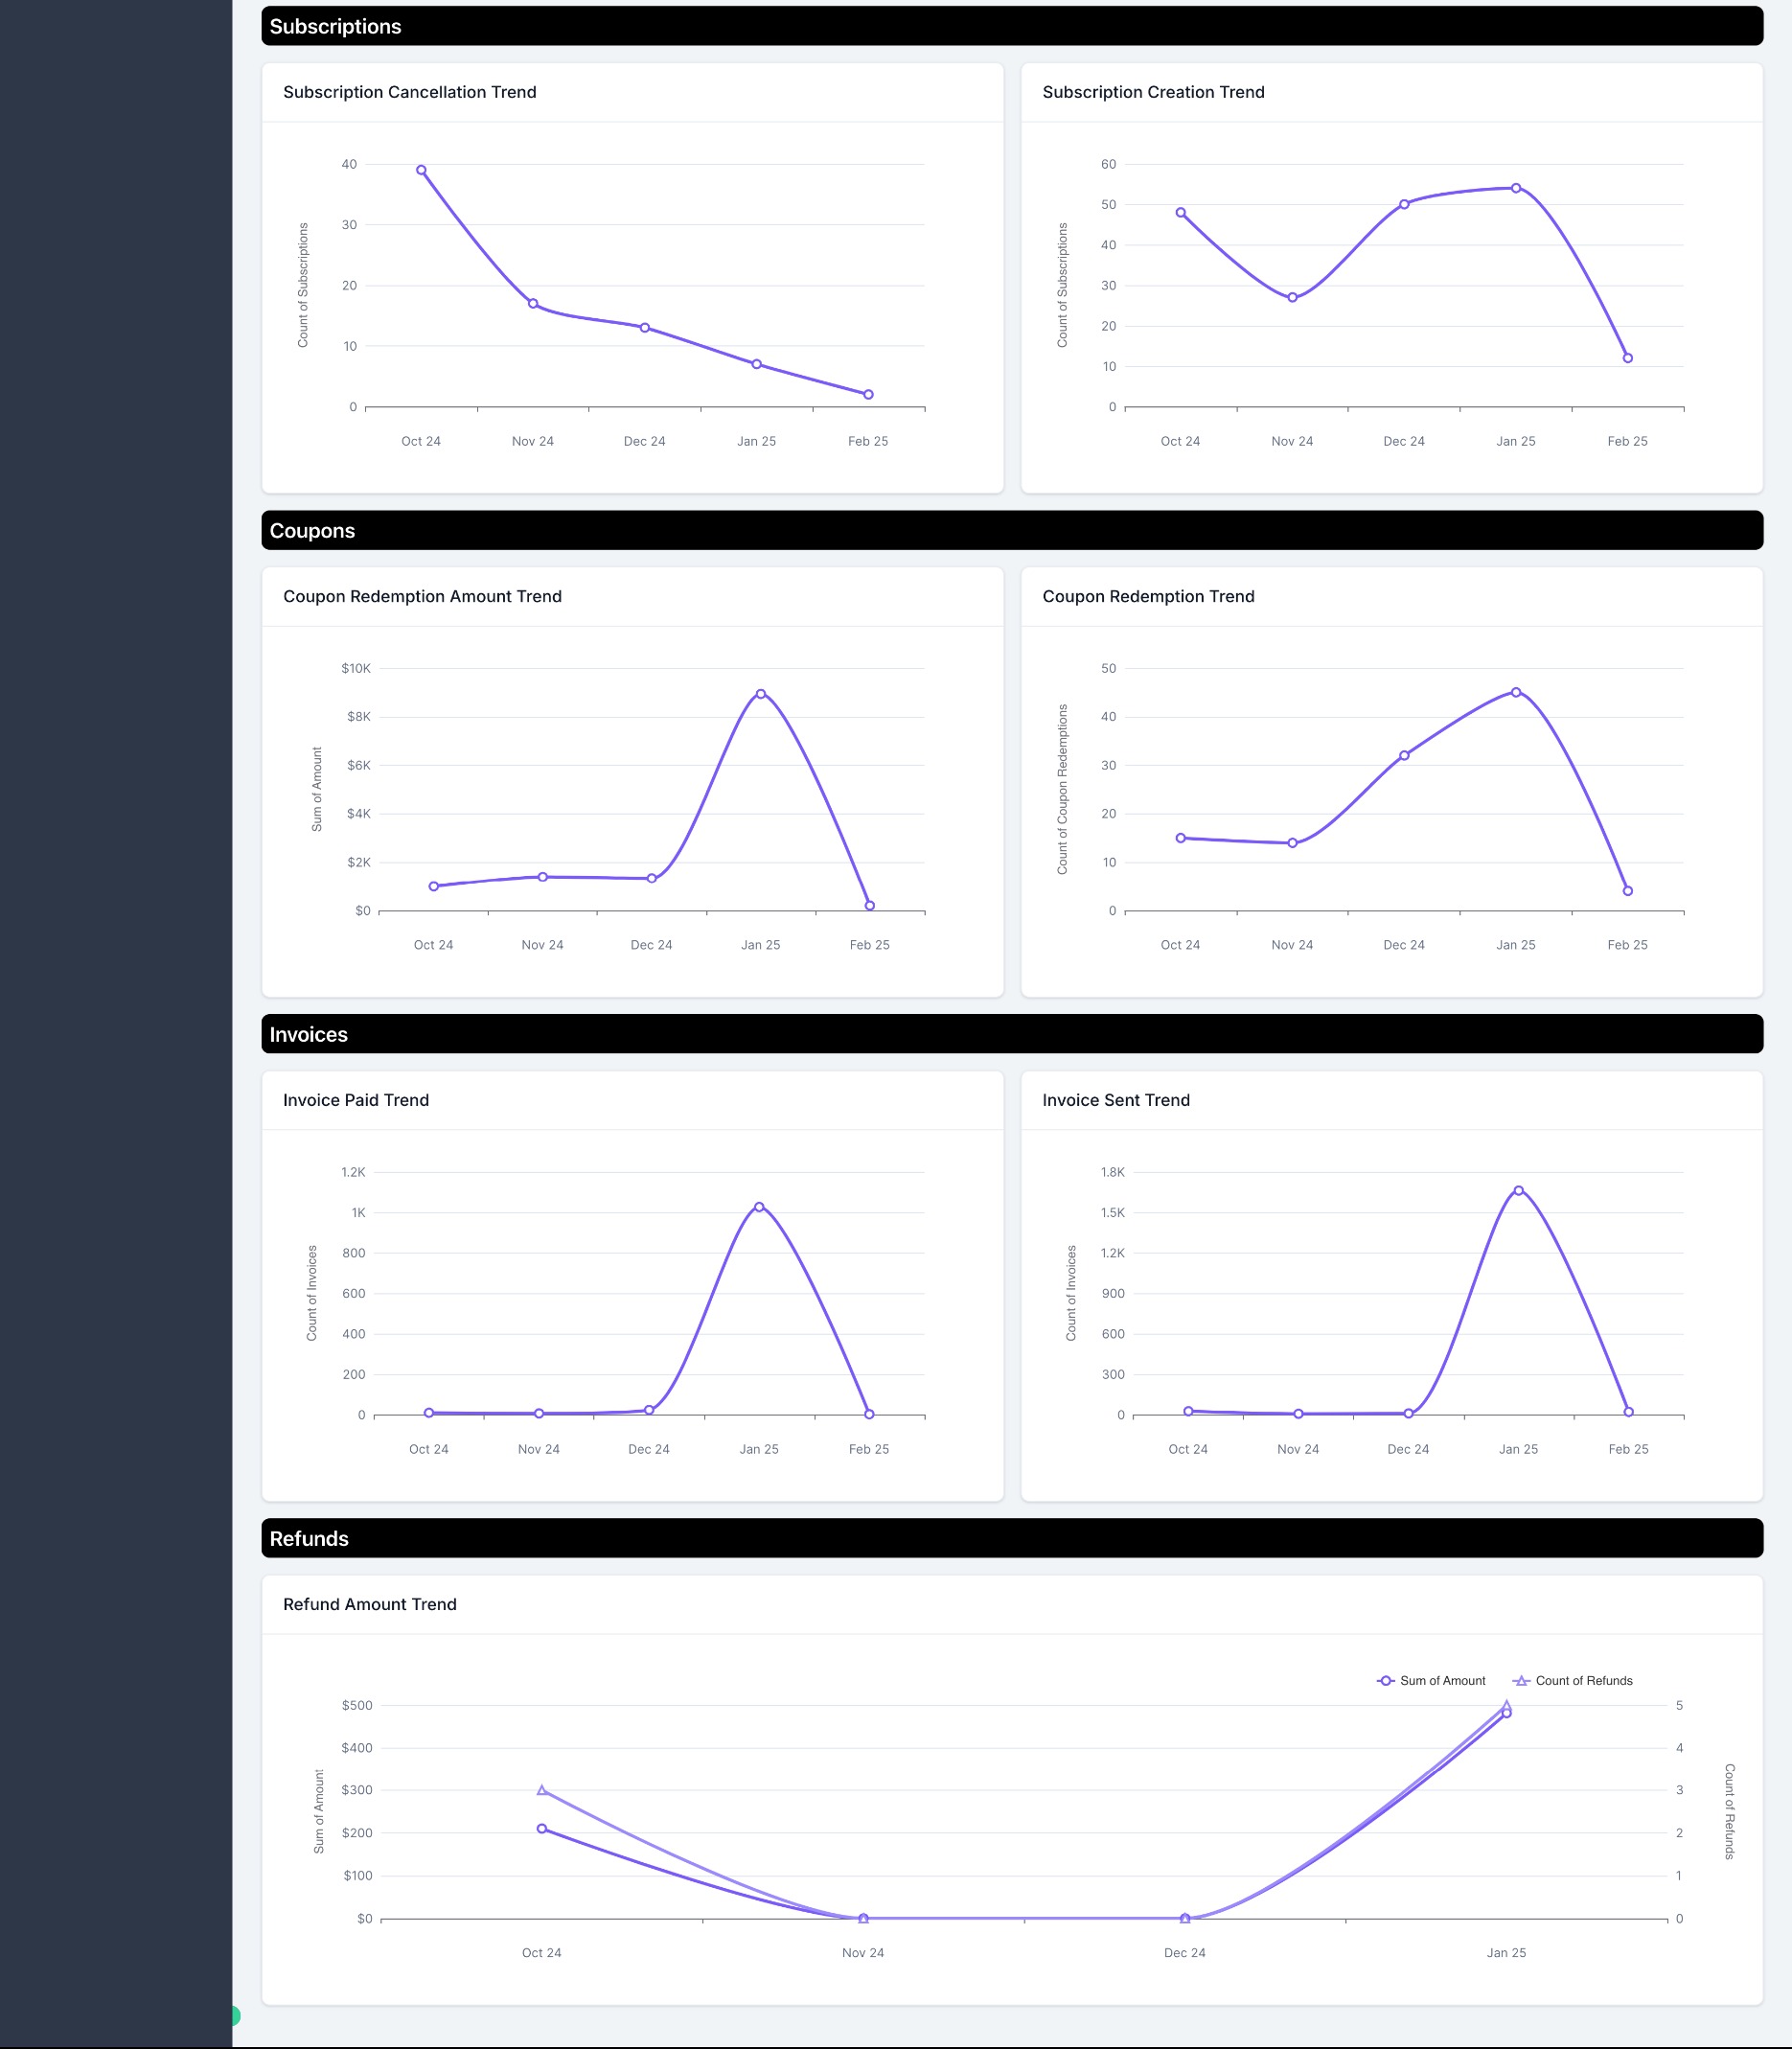
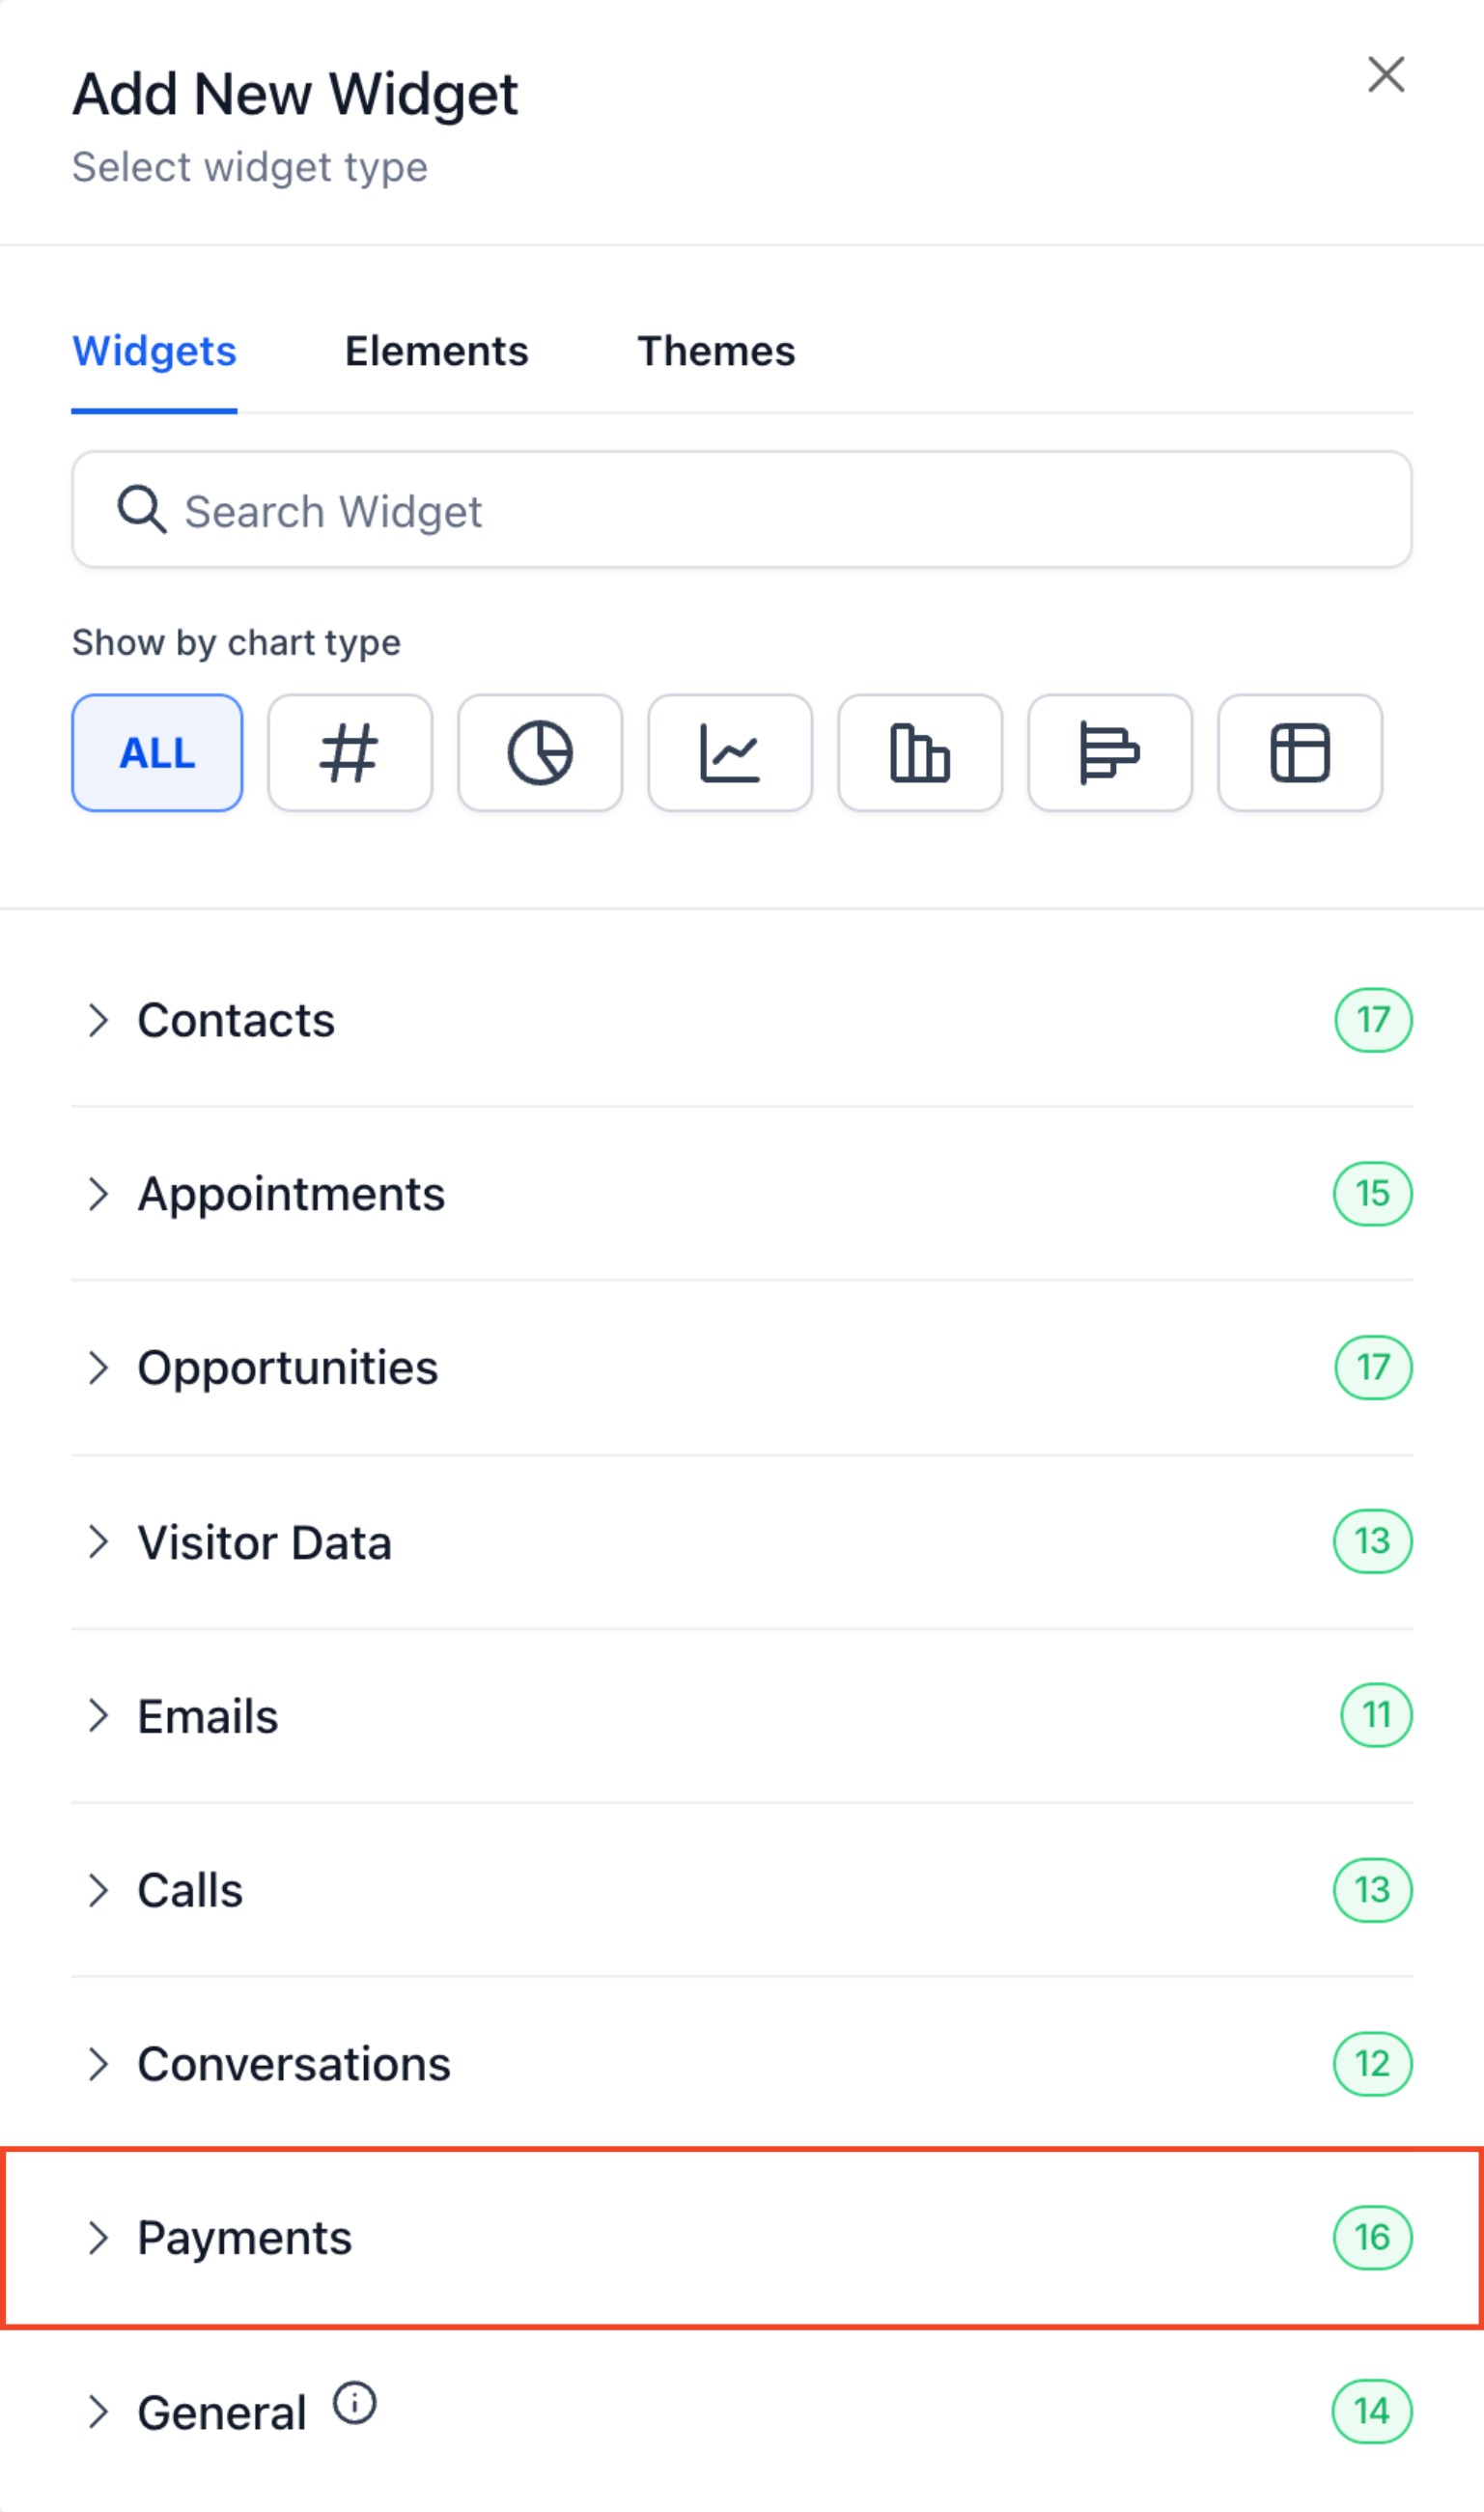
| No. | Widget | Description |
|---|---|---|
| 1 | Total revenue (last month) | Total revenue generated in the last month. |
| 2 | Total revenue trend | Monthly trend of total revenue. |
| 3 | One-off revenue trend | Monthly trend of one-off payments. |
| 4 | Recurring revenue trend | Monthly trend of recurring payments. |
| 5 | Paying customer trend | Monthly trend of paying customers. |
| 6 | Successful payment trend | Monthly trend of payments that went through. |
| 7 | Failed payment trend | Monthly trend of failed payments. |
| 8 | Revenue by channel | Breakdown of revenue by payment channel. |
| 9 | Subscription creation trend | Monthly trend of new subscriptions. |
| 10 | Subscription cancellation trend | Monthly trend of cancelled subscriptions. |
| 11 | Coupon usage trend | Monthly trend of coupon usage. |
| 12 | Coupon discount amount trend | Monthly trend of the discount amounts applied. |
| 13 | Invoices sent trend | Monthly trend of invoices sent. |
| 14 | Invoices paid trend | Monthly trend of invoices paid. |
| 15 | Refund trend | Monthly trend of refunds issued. |
| 16 | Refund amount trend | Monthly trend of total refund amounts. |
General widgets:
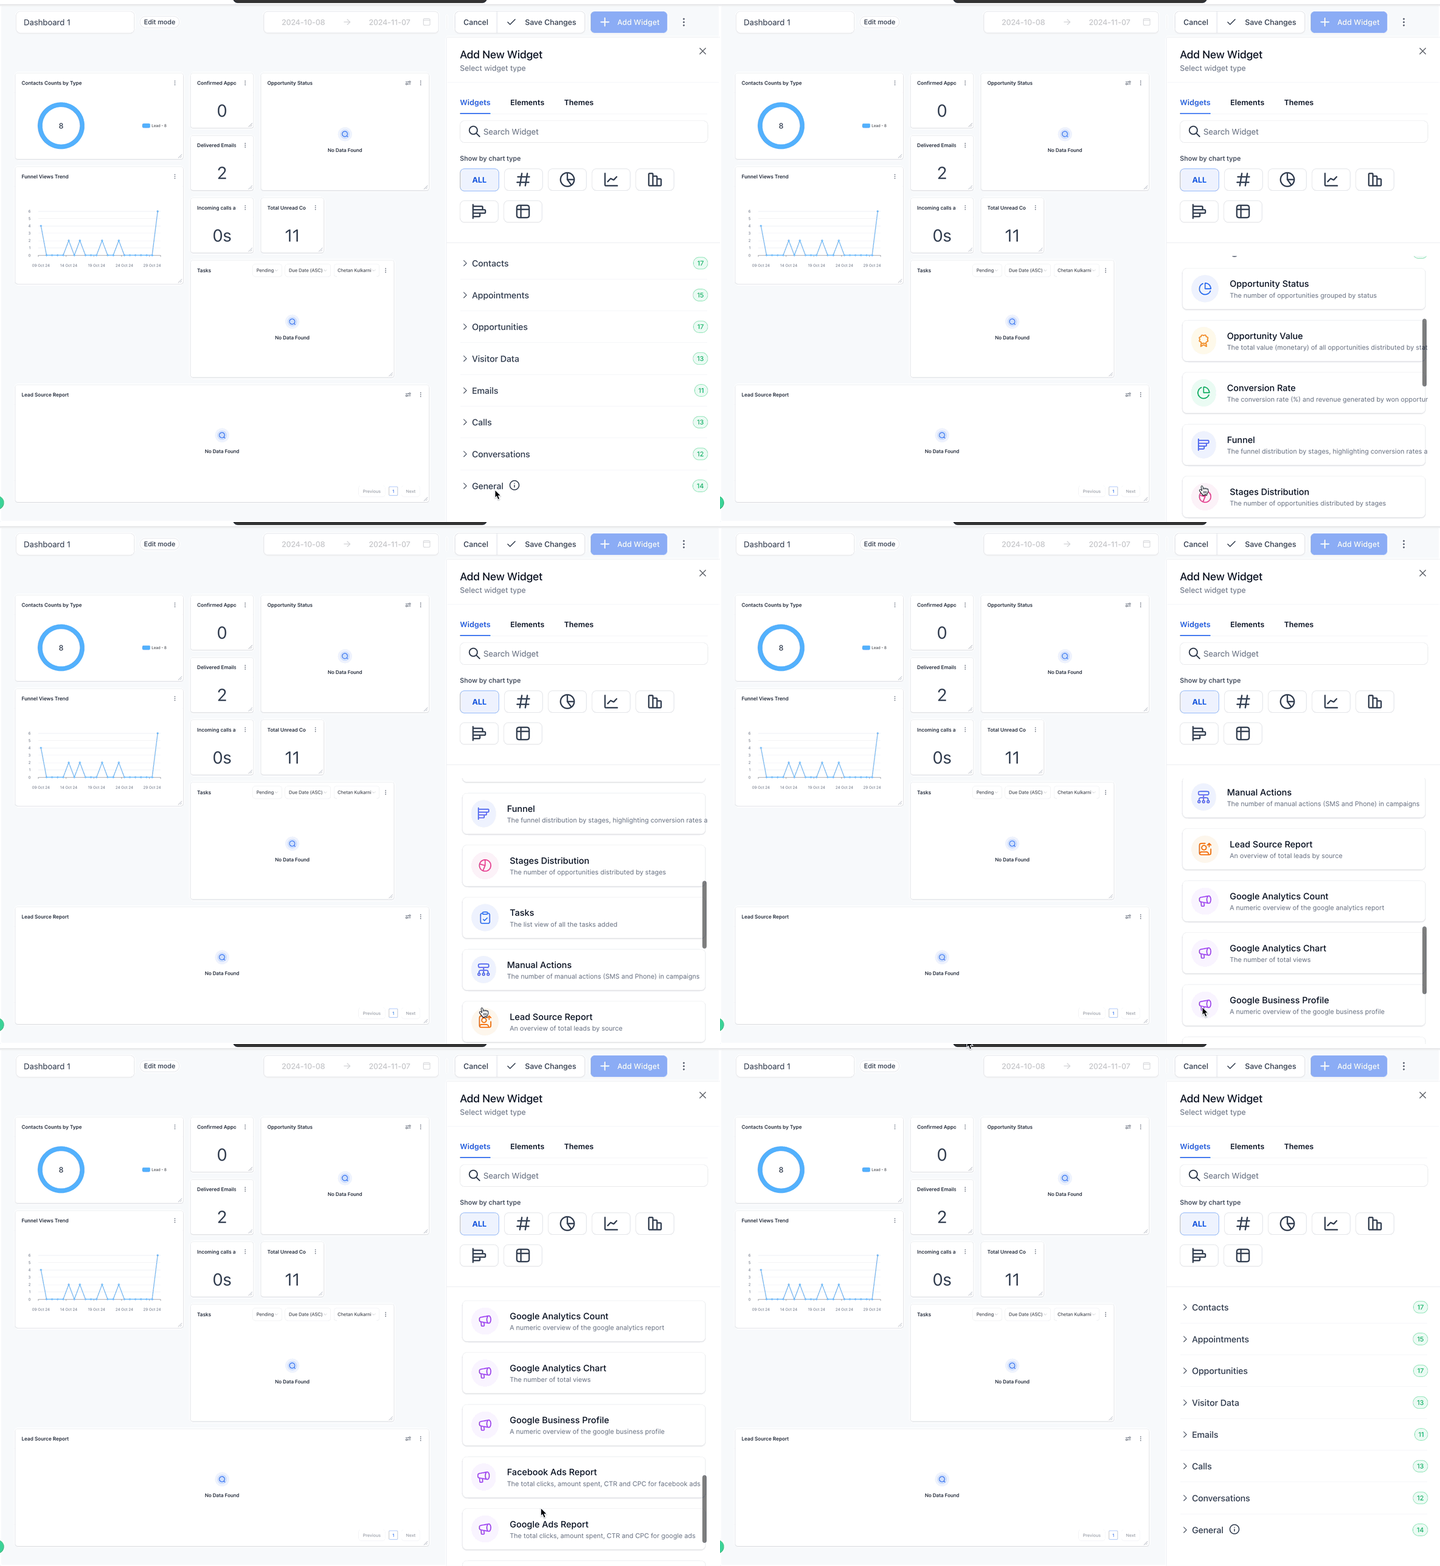
| No. | Widget | Description |
|---|---|---|
| 1 | Opportunity status | Displays the status of your opportunities. |
| 2 | Opportunity value | Understand the total value of opportunities by status. |
| 3 | Conversion rate | Tracks the conversion rate and the revenue from won opportunities. |
| 4 | Funnel | Detailed view of the sales funnel and of conversion rates by stage. |
| 5 | Stage distribution | Understand how opportunities are distributed across the stages. |
| 6 | Tasks | Monitors the tasks added and the team member assigned. |
| 7 | Manual actions | Tracks manual actions such as SMS and calls within campaigns. |
| 8 | Lead source report | Overview of total leads by source. |
| 9 | Google Analytics count | Tracks total views in Google Analytics. |
| 10 | Google Analytics chart | Displays total views and interactions on the website. |
| 11 | Google Business Profile | Monitors your Google Business Profile metrics. |
| 12 | Facebook Ads report | Tracks clicks, spend, CTR and CPC for Facebook ads. |
| 13 | Google Ads report | Tracks clicks, spend, CTR and CPC for Google ads. |
| 14 | Sales efficiency | Sales efficiency report for opportunities. |